Common Agricultural Policy
The Common Agricultural Policy
The EU protects its farmers and growers through its Common Agricultural Policy (CAP). European farmers receive CAP subsidies of around £40 billion each year, and these subsidies account for around 35% of the entire EU spending budget.
Where CAP finances go
Who pays for CAP?
Skip to: The Case of Sugar
Evolution of CAP
CAP was created by the Treaty of Rome (1957) to ensure food supplies for Europe, and provide a fair income for European farmers. The creation of CAP was central to the formation of the European common market, and an early step on the road to European integration.
Why support farmers and growers?
Farmers suffer from three potential problems:
- Farm incomes have fallen because of increasing global food production, and higher yields following the application of new technology in the developing world, and new entrants into the market.
- Farm prices are extremely unstable, largely because of random supply shocks, such as poor weather and disease.
- Farmers and growers have lost power to the large supermarket chains, which can exert their monopsony power in pushing farm prices down.
As a result, farmers are often regarded as a special case for government support. Food is a strategic good, and governments around the world often view food security as a key economic objective. The introduction of CAP, in Europe, was seen as an important step in establishing food security for Europe. Price support schemes, such as guaranteed prices, were first introduced in 1962, and became the main means of supporting European farmers. So effective was the support to farmers, over-production was encouraged, resulting in the infamous wine lakes, butter mountains, and the $2 a-day cow.
Reform of CAP
By the mid 1980s, over-production led to sweeping reforms, including the use of set-aside programmes. Set-aside programmes, which involved the voluntary setting aside of land in an attempt to reduce agricultural surpluses, were introduced into the UK in 1988.
(SOURCE: DEFRA, 2009)
Other measures were introduced during the 1980s and 1990s to limit production, including fixed quotas for milk production, with penalties for over-production. These measured, combined with set-aside, gradually reduced the huge surpluses.
(SOURCE: EUROPEAN COMMISSION).
By the early 1990s, there was a movement away from guaranteed prices (often referred to as product-support), towards direct subsidies to farmers, irrespective of the output produced (often referred to as direct aid). Subsidies are, of course, a form of protection and trade barrier. These reforms are commonly referred to as the MacSharry reforms, after Ray MacSharry, the European Commissioner for Agriculture.
The Agenda 2000 reform encouraged EU farmers to diversify and to re-structure their farms so that they could become more competitive in world markets. Included in this reform package was a reduction in subsidies for selected agricultural products, including cereals, milk, and beef. This would encourage European farmers to become more price-competitive, and enable Europe to increase its export of agricultural products.
The Fischler Reforms of 2003 introduced a Single Farm Payment, which continued the process of decoupling subsidies and farm output. It also introduced a green element to CAP, forcing farmers to meet environmental and animal welfare standards.
(SOURCE: DEFRA)
The UK receives a controversial rebate against payments into the EU to compensate for that fact that it receives relatively little income from CAP in comparison with France and Spain.
(ADDITIONAL SOURCE: THE TIMES, JUNE 2005)
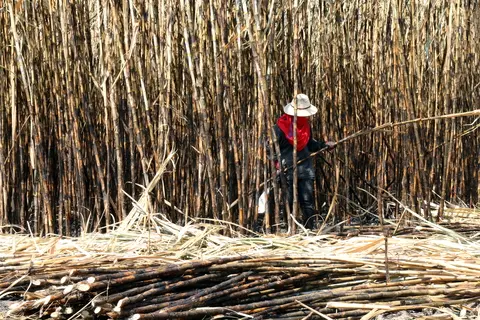
Examples of EU protection
CAP provides considerable support for European sugar producers, with subsidies of around £400 per tonne, and with total subsidies of around $1.5b.
(SOURCES: ASIA TIMES; OXFAM, ‘THE GREAT EU SUGAR SCAM’, 2002)HTTPS://WWW.OXFAM.ORG.UK/
The initial purpose of the subsidy was to enable the vast and growing EU sugar surplus to be exported at the prevailing world price, which was around 4p a pound by 2005, compared to the EU price of 15p.
Estimates suggest that approximately 5m tonnes of excess EU sugar are dumped on world markets each year. The EU uses quotas and tariffs against non-EU sugar imports, including a 200% tariff on sugar-cane from non-EU countries. There are lower tariffs on sugar from certain favoured countries, including Mauritius.
(SOURCES: OXFAM REPORT, 2004 AND; THE TIMES, APRIL 2004).
The combined effect of sugar subsidies is to make Europe the world’s leading exporter of white sugar. Critics argue that the effect of this is to divert trade away from more efficient sugar producers, especially those based a number of African countries.
In 2005, following complaints from Brazil, Tailand and Australia, the WTO imposed an annual limit on subsidised EU sugar of 1.37m tonnes.
See: WTO Green Box definitions
The Case of Textiles
Since the 1970s the EU has imposed quotas and tariffs on textile imports. During 2005, the EU blocked imports of textiles from China because it had exceeded its quota for clothing items such as T-shirts, knitwear and dresses.