Equilibrium
Equilibrium
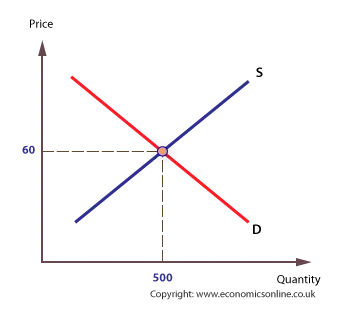
Equilibrium is a state of balance in an economy, and can be applied in a number of contexts. In elementary micro-economics, market equilibrium price is the price that equates demand and supply in a particular market. In this situation the market ‘clears’ at the equilibrium price – everything that is taken to market by producers is taken out of the market by consumers. This situation is commonly referred to as ‘partial’ equilibrium.
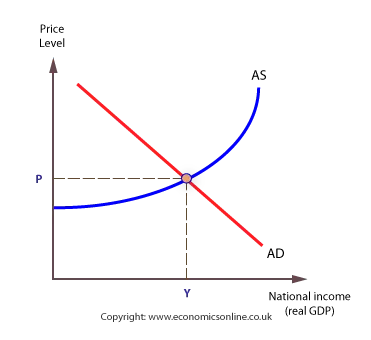
In introductory macro-economics, national income is in equilibrium when aggregate demand (AD) equals aggregate supply (AS).
Disequilibrium occurs when a variable changes to create an excess of demand or supply, causing a ‘movement’ to a new equilibrium position. A sudden change is called an economic shock.
General equilibrium theory attempts to show how all markets move towards a co-ordinated equilibrum – this situation was first described by French 19th century economist Leon Walras.
Micro-economic equilibrium
Macro-economic equilibrium