
Price elasticity of demand
Price elasticity of demand (PED) shows the relationship between price and quantity demanded and provides a precise calculation of the effect of a change in price on quantity demanded.
The following equation enables PED to be calculated.
We can use this equation to calculate the effect of price changes on quantity demanded, and on therevenue received by firms before and after any price change.
For example, if the price of a daily newspaper increases from £1.00 to £1.20p, and the daily sales falls from 500,000 to 250,000, the PED will be:
The negative sign indicates that P and Q are inversely related, which we would expect for most price/demand relationships. This is significant because the newspaper supplier can calculate or estimate how revenue will be affected by this change in price. In this case, revenue at £1.00 is £500,000 (£1 x 500,000) but falls to £300,000 after the price rise (£1.20 x 250,000).
The range of responses
The degree of response of quantity demanded to a change in price can vary considerably. The key benchmark for measuring elasticity is whether the co-efficient is greater or less than proportionate. If quantity demanded changes proportionately, then the value of PED is 1, which is called ‘unit elasticity’.
PED can also be:
-
Less than one, which means PED is inelastic.
-
Greater than one, which is elastic.
-
Zero (0), which is perfectly inelastic.
-
Infinite (∞), which is perfectly elastic.
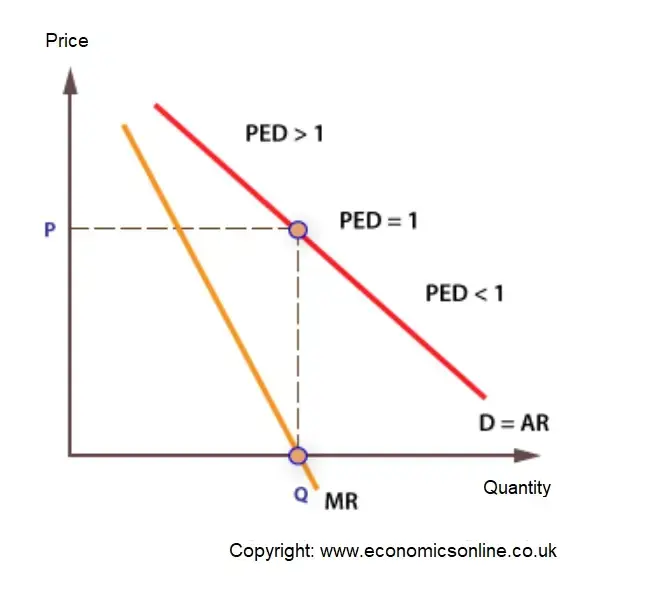
PED along a linear demand curve
PED on a linear demand curve will fall continuously as the curve slopes downwards, moving from left to right. PED = 1 at the midpoint of a linear demand curve.
PED and revenue
There is a precise mathematical connection between PED and a firm’s revenue.
Revenue is measured in threee ways:
-
Total revenue (TR), which is found by multiplying price by quantity sold (P x Q).
-
Average revenue (AR), which is found by dividing total revenue by quantity sold (TR/Q). Average revenue is also the revenue per unit sold, which is also the price.
-
Marginal revenue (MR), which is defined as the revenue from selling one extra unit. This is calculated by finding the change in TR from selling one more unit.
Consider these figures and calculate Total, Marginal and Average Revenue.
PRICE
(£)Qd TR MR AR 10 1 9 2 8 3 7 4 6 5 5 6 4 7 3 8 2 9 1 10
Study the patterns of numbers and see if you can analyse the relationships between the three measures of revenue – then answer the following:
-
How are price and average revenue connected?
-
What happens to total revenue as output increases?
-
What is the connection between total revenue and marginal revenue?
-
How are marginal revenue and average revenue connected?
Observations
When TR is at a maximum, MR = zero, and PED = 1
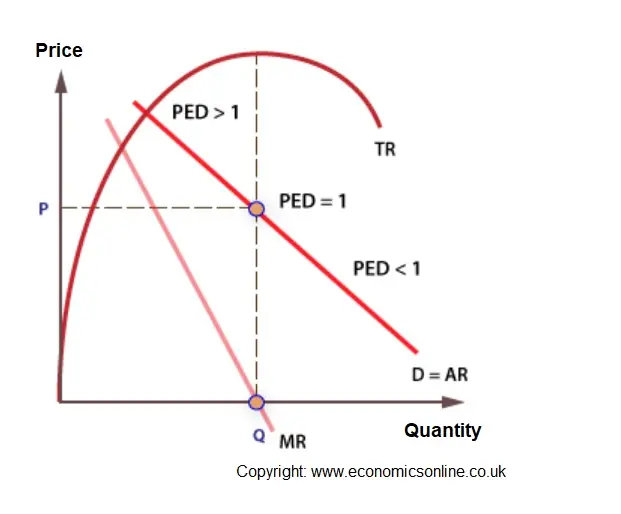
- Price and AR are identical, because AR = TR/Q, which is P x Q/Q, and cancel out the Qs to get P.
- A curve plotting AR (=P) against Q is also a firm’s demand curve.
- TR increases, reaches a peak and decreases.
Why does a firm want to know PED?
There are several reasons why firms gather information about the PED of its products. A firm will know much more about its internal operations and product costs than it will about its external environment. Therefore, gathering data on how consumers respond to changes in price can help reduce risk and uncertainly. More specifically, knowledge of PED can help the firm forecast its sales and set its price.
Sales forecasting
The firm can forecast the impact of a change in price on its sales volume, and sales revenue (total revenue, TR). For example, if PED for a product is (-) 2, a 10% reduction in price (say, from £10 to £9) will lead to a 20% increase in sales (say from 1000 to 1200). In this case, revenue will rise from £10,000 to £10,800.
Pricing policy
Knowing PED helps the firm decide whether to raise or lower price, or whether to price discriminate. Price discrimination is a policy of charging consumers different prices for the same product. If demand is elastic, revenue is gained by reducing price, but if demand is inelastic, revenue is gained by raising price.
Non-pricing policy
When PED is highly elastic, the firm can use advertising and other promotional techniques to reduce elasticity.
Determinants of PED
There are several reasons why consumers may respond elastically or inelastically to a price change, including:
The number and ‘closeness’ of substitutes
A unique and desirable product is likely to exhibit an inelastic demand with respect to price.
The degree of necessity of the good
A necessity like bread will be demanded inelastically with respect to price.
Whether the good is habit forming
Consumers are also relatively insensitive to changes in the price of habitually demanded products.
The proportion of consumer income which is spent on the good
The PED for a daily newspaper is likely to be much lower than that for a new car!
Whether consumers are loyal to the brand
Brand loyalty reduces sensitivity to price changes and reduces PED.
Life cycle of product
PED will vary according to where the product is in its life cycle. When new products are launched, there are often very few competitors and PED is relatively inelastic. As other firms
launch similar products, the wider choice increases PED. Finally, as a product begins to decline in its lifecycle, consumers can become very responsive to price, hence discounting is extremely common.
Test your knowledge with a quiz
Press Next to launch the quiz
You are allowed two attempts – feedback is provided after each question is attempted.
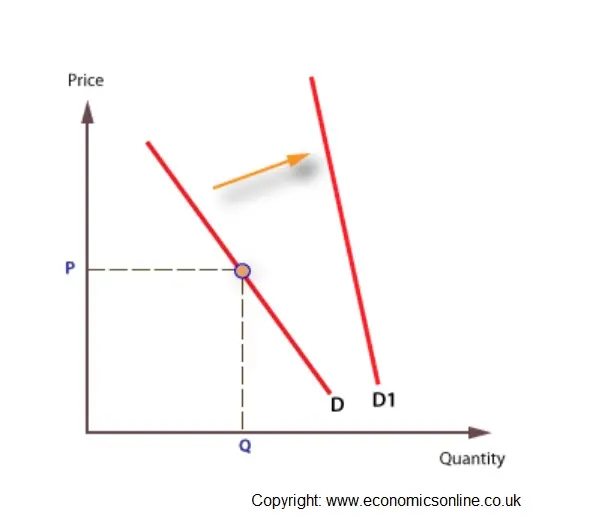
The effects of advertising
Firms may use persuasive advertising by to win new customers and retain the loyalty of existing ones.
Advertisers use a range of media, including television, press, and electronic media. Advertising will shift demand to the right, and make demand less elastic.
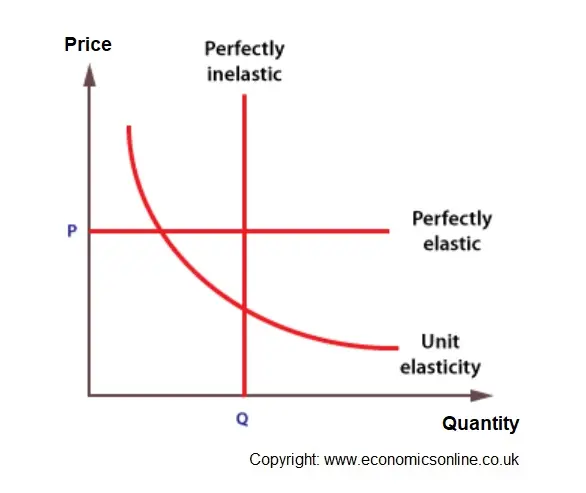
There are three extreme cases of PED.
-
Perfectly elastic, where only one price can be charged.
-
Perfectly inelastic, where only one quantity will be purchased.
-
Unit elasticity, where all the possible price and quantity combinations are of the same value. The resultant curve is called a rectangular hyperbola.
Go to: point elasticity of demand
PED can also be illustrated through indifference curve analysis