
Consumer and Producer Surplus
Consumer surplus
Consumer surplus is derived whenever the price a consumer actually pays is less than they are prepared to pay. A demand curve indicates what price consumers are prepared to pay for a hypothetical quantity of a good, based on their expectation of private benefit.
For example, at price P, the total private benefit in terms of utility derived by consumers from consuming quantity, Q is shown as the area ABQC in the diagram.
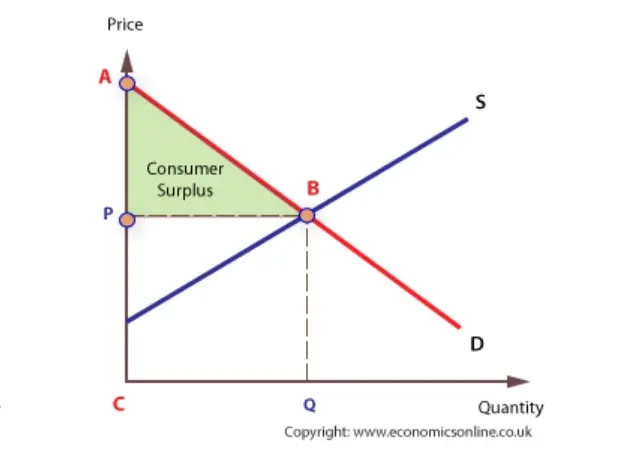
The amount consumers actually spend is determined by the market price they pay, P, and the quantity they buy, Q – namely, P x Q, or area PBQC. This means that there is a net gain to the consumer, because area ABQC is greater that area PBQC. This net gain is called consumer surplus, which is the total benefit, area ABQC, less the amount spent, area PBQC. Hence ABQC – PBQC = area ABP.
Declining consumer surplus
Consumer surplus generally declines with consumption. One explanation for this is the law of diminishing marginal utility, which suggests that the first unit of a good or service consumed generates much greater utility than the second, which generates greater utility than the third and subsequent units. A very thirsty consumer will be prepared to pay a relatively high price for their first soft drink, but, as they drink more, less utility is derived and the price they would be prepared to pay falls. Therefore, in the above diagram, as consumption rises from zero, at C, to Q, marginal utility falls. As utility falls, the price that consumers are prepared to pay declines, causing the demand curve to slope down from A to B.
Some firms can capture this consumer surplus by charging the highest price that consumers would be prepared to pay, rather than charge price P for all units consumed.
See also: price discrimination.
Test your knowledge with a quiz
Press Next to launch the quiz
You are allowed two attempts – feedback is provided after
each question is attempted.
Producer surplus
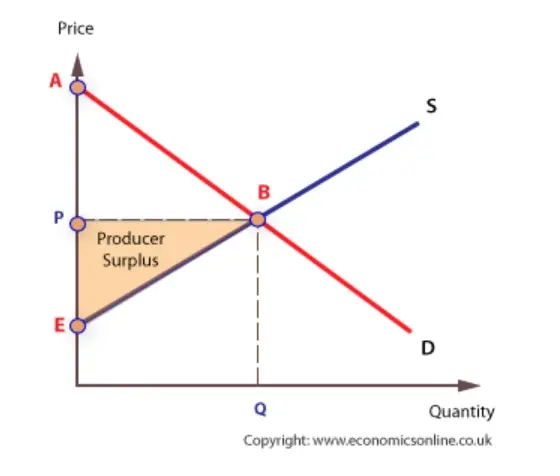
Producer surplus is the additional private benefit to producers, in terms of profit, gained when the price they receive in the market is more than the minimum they would be prepared to supply for. In other words they received a reward that more than covers their costs of production.
The producer surplus derived by all firms in the market is the area from the supply curve to the price line, EPB.
See also: profits
Economic welfare
Economic welfare is the total benefit available to society from an economic transaction or situation.
Economic welfare is also called community surplus. Welfare is represented by the area ABE in the diagram below, which is made up of the area for consumer surplus, ABP plus the area for producer surplus, PBE.
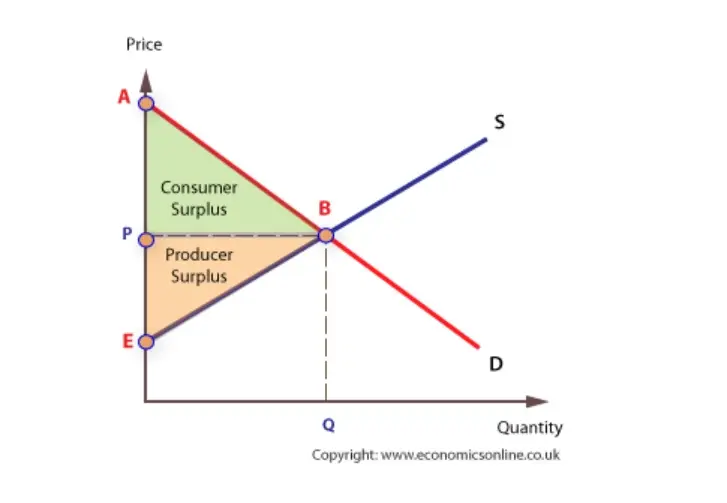
In market analysis economic welfare at equilibrium can be calculated by adding consumer and producer surplus.
Welfare analysis considers whether economic decisions by individuals, organisations, and the government increase or decrease economic welfare.