
Price stabilisation
Stable prices
Price stability exists when average prices are constant over time, or when they are rising at a very low and predictable rate. Price inflation occurs when average prices are rising above this low and predictable rate, and price deflation occurs when average prices are falling. In both cases, the effects are potentially extremely harmful to a country’s economic performance and to the welfare of its citizens. For this reason, price stability is commonly regarded as the single most important macro-economic objective.
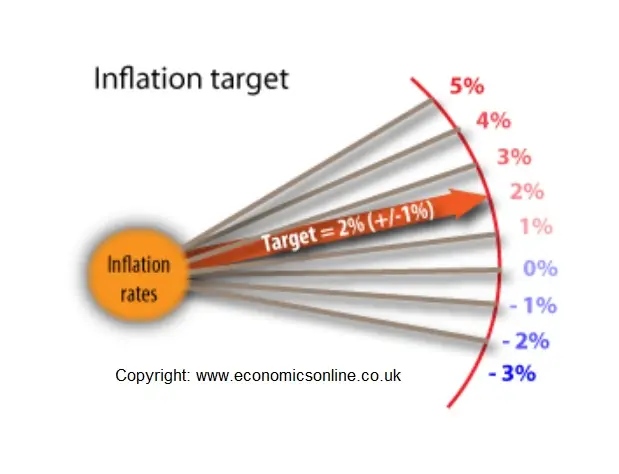
For the UK, price stability means ensuring that the price level increases gradually, by an average of no more than 2% per year. The official target is 2%, though there is a safety margin of +/- 1%. The Bank of England is forced to intervene if inflation falls outside of these limits.
The costs of inflation
Price inflation is regarded as a serious economic problem because it causes a number of significant costs to an economy, including the following:
It erodes the value of money and assets
A rise in the price level means, ceteris paribus, that money can buy fewer goods. If assets are stored in a monetary form, inflation means that asset values fall. This explains why, during inflationary periods, individuals often choose to put their wealth into physical assets, like property, rather than keep it in a monetary form in a bank account.
It redistributes income between groups
Inflation can create a random redistribution of income given that inflation does not have an equal impact on individuals and groups. For example, individuals who can protect their earnings or their assets from inflation will increase their income relative to those who cannot. Similarly, borrowers do better at times of rising prices because the real value of their repayments are reduced over time. Lenders need to charge a higher interest rate to compensate for the falling value of the repayments to them, and for the loss of liquidity suffered as the value of repayments fall.
It is bad for the balance of payments
The balance of payments may deteriorate because domestic inflation stimulates import spending, given that imports appear relatively cheaper, and dampens export sales, as exports appear more expensive abroad.
It causes uncertainty and falling investment
Firms respond unfavourably to inflation for several reasons. Firstly, inflation dampens consumer confidence and spending, and reduces aggregate demand. Secondly, inflation increases costs and reduces competitiveness, which can lead to falling demand. Finally, firms may anticipate that interest rates will have to rise to deal with inflation, and this undermines business confidence. Falling confidence is likely to force firms to postpone capital investment.
It creates ‘shoe leather’ and ‘menu’ costs
Shoe leather costs can be incurred during times of inflation when households and firms make an additional effort to seek out the best deals. These costs are also called search costs, reflecting the increased time spent attempting to find the lowest available prices. The Internet, and the growth of price comparison sites, has considerably reduced the problem of search costs, making information freely and quickly available. Menu costs are associated with having to regularly re-price products to bring them in line with general inflation.
It can create unemployment
Inflation can lead to a loss of jobs through its effect on costs. As costs rise firms may substitute labour with other factors, such as new technology.
Inflation distorts the price mechanism and creates inflation noise
When average prices rise, the price mechanism cannot effectively fulfill its role as a resource allocating mechanism. Markets work best when prices rise and fall, providing information about relative values, but if average prices rise continuously, with increases outweighing decreases, resource allocation is distorted. The distortionary effect is called inflation noise which can occur when consumers and producers misperceive relative prices and costs. The effect is most significant when the rate of inflation is excessive. When inflation rates approach zero, inflation noise is minimised.
It creates money illusion
Money illusion, also called inflation illusion, is a phenomenon that may arise when rising prices lead people to make irrational decisions. For example, if wages rise, workers may decide to work longer hours, but if inflation erodes the value of the wage rise they have been ‘fooled’ into working longer.
Deflation
Price deflation, which means falling average prices, can also cause severe economic problems, including the following.
Consumers may delay consumption
Consumers may wait for prices to fall even further, and this can have a negative impact on AD, output and incomes.
Real interest rates are pushed up
Given that nominal interest rates cannot fall below zero, falling prices cause real rates to rise. For example, if nominal interest rates are currently 5% and inflation is 1%, real interest rates are 4% (which is 5% – 1% = 4%). However, if the price level falls by 2%, real interest rates (5% – [-2%]) rise to 7%. Of course, nominal rates can be reduced, but deflation tends to put upward pressure on real rates.
Rising debt burdens
Deflation will cause debt burdens to rise for households that have borrowed in the past. Many consumer and corporate debts are fixed, including fixed mortgages and personal loans, and repayments do not fall as prices fall, making the real price of the debt rise. For firms, falling prices also create a debt burden because, although revenues fall, debt repayments may remain at the old level, increasing the real debt burden.
Recession
Deflation can significantly reduce economic confidence, and households and firms may be encouraged to save rather than spend, despite falling interest rates. As non-essential spending falls, economic activity will fall, creating a deepening recession that even near zero interest rates may not budge. Long-term recession, following a period of deflation is often referred to as the Japanese disease, given that, for a long period during the 1990s, Japan seemed trapped in a deflationary spiral.
Measuring price changes
Measuring changes in average price levels requires the use of a device called an index. It is impossible to keep an accurate record of every price change for every good and service in the economy at all times. In 1914, the UK Government began to monitor food prices to help protect workers during the First World War. In 1916, price checks on clothing, fuel and a few other items were added to generate a simple cost of living index. (Source: ONS).
Today, the UK uses a number of indices to track price changes, including the Consumer Price Index (CPI), which was introduced in 2003, and the much older Retail Price Index (RPI) which was introduced in 1947. Using an index allows a general picture to develop to show the average price change for a sample of goods and services, measured at monthly intervals.
The CPI is based on the European Harmonised Index of Consumer Prices (HICP) and its introduction in the UK allowed for more accurate inflation comparisons between the UK and Europe.
Indices
All indices, like the CPI and RPI, have certain key features in common, including:
- The use of a sample of typical goods and services bought by ‘average’ households.
- The use of a sample of different retail outlets, such as corner shops, supermarkets, and specialist stores taken from across the country.
- The tracking of changes in prices from a given starting point, a base year.
- The allocation of different types of good with different weights to reflect their varying importance in the consumer’s shopping basket.
- Changes are expressed in terms of the number 100 . An index of 110 means 10% inflation since the base year, and an index of 92 means 8% deflation since the base year.
Simple example
| GOOD | % INCOME SPENT | PRICE CHANGE | INDEX | WEIGHTS | WEIGHTED INDEX |
| A | 40 | + 10 | 110 | 4 | 440 |
| B | 30 | + 15 | 115 | 3 | 345 |
| C | 20 | 0 | 100 | 2 | 200 |
| D | 10 | – 8 | 92 | 1 | 92 |
| Weighted Price Index | 1007/10 = 107.7 | ||||
The weighted index is arrived at by multiplying the individual price index by the weights.
The CPI
The Consumer Price Index (CPI) is calculated by tracking the price movements of 650 items, which represents a basket of goods and services typically bought by the ‘average’ UK household. The basket is updated annually to keep it as representative as possible, and prices are checked on a monthly basis by recording prices at outlets across the UK.
Goods and services are put into one of 12 categories, as shown:
| CATEGORY | OVERALL WEIGHT % | SUB CATEGORIES |
| Food and beverages | 11.8 | 22 |
| Alcohol and tobacco | 4.4 | 4 |
| Clothing and footwear | 5.7 | 11 |
| Housing and household services | 12.6 | 5 |
| Furniture and household goods | 6.6 | 11 |
| Health | 2.2 | 3 |
| Transport | 15.1 | 6 |
| Communication | 2.3 | 1 |
| Recreation and culture | 14.5 | 17 |
| Education | 2.1 | 1 |
| Restaurants and hotels | 12.8 | 8 |
| Miscellaneous | 9.9 | 11 |
| Source: ONS | ||
RPIx and RPIy
Until 2003, the RPI was the main indicator of price changes and provided what was called the ‘headline rate’ of inflation. The RPI was then adjusted to include or exclude particular items, including the RPIx and RPIy adjustments. The RPI is a broader measure of inflation than the CPI because it includes costs associated with housing, which the RPI does not.
RPIx is the headline RPI index, minus changes in mortgage interest payments. Taking out mortgage repayments is considered a useful adjustment because the UK housing market plays a significant role in the wider macro-economy. Given that over 60% of householders are owner occupiers, many of whom are repaying mortgages, changes in interest rates, and mortgage rates, can have a considerable impact on spending and the rest of the economy.
Interest rates, which affect mortgage rates, are part of anti-inflationary policy, so it is argued there is a good reason to exclude mortgage costs. A rise in interest rates, designed to reduce inflationary pressure, would push up the RPI, but not the RPIx, so the effects of the policy can be better monitored by looking at RPIx.
Hence, monitoring changes in the RPIx allows policy makers to see the underlying trend in inflation. RPIy is the RPIx minus changes in indirect taxes, such as VAT. Changes in VAT distort inflation data, and make the index less accurate in terms of measuring underlying inflationary pressure, hence it may be useful, at times of increasing VAT rates, to exclude the effects of these changes on retail prices.
The RPIx and RPIy are measures of inflation still recorded and used in the UK, despite the introduction of the CPI in 2003. A large number of wage negotiations are based on the RPI, rather than CPI, which is one reason why the RPI is likely to be used in the future.
Comparing the CPI and RPI
Comparing the Retail Price Index (RPI) and the Consumer Price Index (CPI) raises the following issues:
Mathematical technique of calculation
The RPI uses an arithmetic average of price changes whereas the CPI uses a geometric average, which makes the CPI mathematically more precise. This is because it can continually capture the effects of changes in consumer spending patterns in response to inflation or deflation.
Adjustment
A potential problem with price indices is that they may not adjust quickly enough to reflect changes in spending. Indices are based on a sample of goods and services which are weighted according to how important the good is to the consumer. The importance of a good is based on how much of household income is spent on a product. For example, a typical household may spend 10% of their income on holidays, and therefore holidays will be given 10% of the weighting. But what happens if the cost of a holiday rises by 20%, as a result of a fall in Sterling? Consumers are likely to respond, and reduce their holiday spending. If they now spend only 5% of their income on holidays, the weighting used in the CPI index can be quickly adjusted to 5%. However, the older RPI could not be adjusted so quickly, and could not resolve the problem of changing spending patterns.
Because of this, and because the CPI does not include housing costs, or council taxes, the RPI gives a slightly higher rate than does the CPI. The CPI gives a higher weighting to energy costs, so change in oil prices have a bigger impact on the CPI inflation rate.
This means that the Bank of England, using the CPI, can set a target of 2% inflation, and not 2.5%. Despite this, the UK authorities still track the RPIx and RPIy.
Evaluation of all indices
In general terms all indices can be criticised for a number of reasons, including:
Are the samples representative?
If we look at specific types of household, we can get quite different measures of inflation to the general index. For example, if in a given year, the prices of textbooks and rented accommodation for students rise above the average inflation rate, a household made up of students may face a relatively high inflation rate compared with a more typical household. In addition, there is likely to be a regional variation from the average. Therefore, it is quite possible that a married doctor in Manchester experiences a personal inflation rate of 2% whereas a single bus driver living in London, experiences a personal inflation rate of 7%.
Do goods stay the same over time?
A motor vehicle may have ‘inflated’ in price by 20% over a five-year period, but is this actually price inflation? The vehicle may be faster, more efficient on petrol, more comfortable, and safer – so much of the price increase is due to improvements in the vehicle and not to inflation.
When products are fairly standardised, like a litre of milk, or a loaf of bread, quality changes will be small, and the price index will give a more accurate reading of genuine price inflation. With non-standardised products, indices are far less useful.
The recently highlighted problem of shrink-flation, where many producers have reduced the physical size or volume of their manufactured goods, is further evidence of how true inflation rates can be hidden.
How up-to-date is the basket?
Indices are usually out of date because the basket used does do not always change quickly enough to reflect current fashions and spending trends. Improvements have been made in terms of adding new goods to the basket, but it still takes up to three years to include new products. Given that new technology products are initially sold at premium prices, the implication is that the current basket always understates true inflation because of the time lag in introducing new technology products.
Why not measure capital goods prices?
Only consumer goods tend to be considered in price indices because the focus of inflation measurement is on households, and not on firms. There is an argument that capital goods prices should be included in a general inflation index.
A ‘two-speed’ economy
On index may not be good enough if two different sectors of the economy are inflating at different rates. In the UK goods sector, inflation has fallen steadily over the last 15 years, with many goods actually deflating in price. In contrast, service sector inflation has continued at around 4% to 6% per year. An index will average out these two sectors, and it is this average rate that forms the basis of policymaking decisions. This certainly creates a dilemma for policy makers; should they be more conscious of service sector inflation or of goods sector deflation?
Targeting inflation
It is generally recognised that a small amount of inflation is acceptable, with the objective of monetary policy being low and predictable inflation rates. Certainly, given a choice between mild inflation and mild deflation, mild inflation would be the chosen option. Between 1997, when the Bank of England was made independent, and 2004 the (RPI) target rate for inflation was 2.5%, which was an acknowledgement that a little inflation was acceptable.
The CPI target
Since 2003, with the adoption of the CPI, the target has been 2%. The Bank of England must act by increasing or reducing interest rates to achieve this target.
The CPI and RPI give a broadly similar picture of retail inflation. Following poor crop harvests, rising food prices contributed to a surge in inflation during 2010, which extended into 2011. During 2012 the rate of inflation fell back as the costs shocks worked their way out of the system. From 2012, the CPI edged down towards zero percentage, and well below its target rate of 2% (+/- 1%).
The RPI often gives a higher value for inflation when mortgage costs are high. This is down to the different weighting of housing and housing costs in the two indices. The RPI is often more volatile. The RPI is a broader measure than the CPI, and, unlike the CPI, includes a number of housing costs, such as council tax, mortgage repayments, and buildings insurance. A higher and more volatile RPI can be explained because many housing costs, such as council tax and buildings insurance, have risen consistently over the last 15 years. In addition, the volatility of interest rates has had a significant impact on those households with variable rate mortgages.
The CPIh
In 2016, the National Statistician announced that the CPIh would become the preferred measure of inflation. The CPIh includes owner occupiers’ housing costs – a key component of household spending.
CPIh, CPI and RPI (2012 – 2018)
See: inflation update for latest news