
A photo of a stack of stones.
Equilibrium Quantity
What is Equilibrium Quantity?
Equilibrium quantity means the number of units of a product that are traded in the market at the market equilibrium price. This quantity is also called the quantity traded or the quantity bought and sold. At equilibrium price, buyers buy this quantity and sellers sell it. This quantity is determined when the market gets to equilibrium, which happens when the demand for a product is equal to its supply at the equilibrium price. In other words, equilibrium quantity means that the demand and supply curves intersect at one point, which indicates market equilibrium where the quantity demanded (Qd) of a product is equal to the quantity supplied (Qs). In simple words, equilibrium quantity means that the market has reached a situation of equilibrium in which the price is stable, which is accepted by both buyers and sellers in the market.
Let’s define a few key terms related to the concept of equilibrium quantity.
Market Equilibrium
Market equilibrium refers to a situation of a market when quantity demanded is equal to quantity supplied and there is no tendency to change. In economics, equilibrium means a state of stability. So, in market equilibrium, the forces of demand and supply become equal, and, as a result, the price of the product becomes stable. This state of equilibrium does not change unless and until some other factors are changed. When there is an excess supply of the product, the price falls, and when there is an excess demand for the product, the price rises, but when demand and supply are equal to each other, then the market is in equilibrium. The following diagram illustrates market equilibrium:
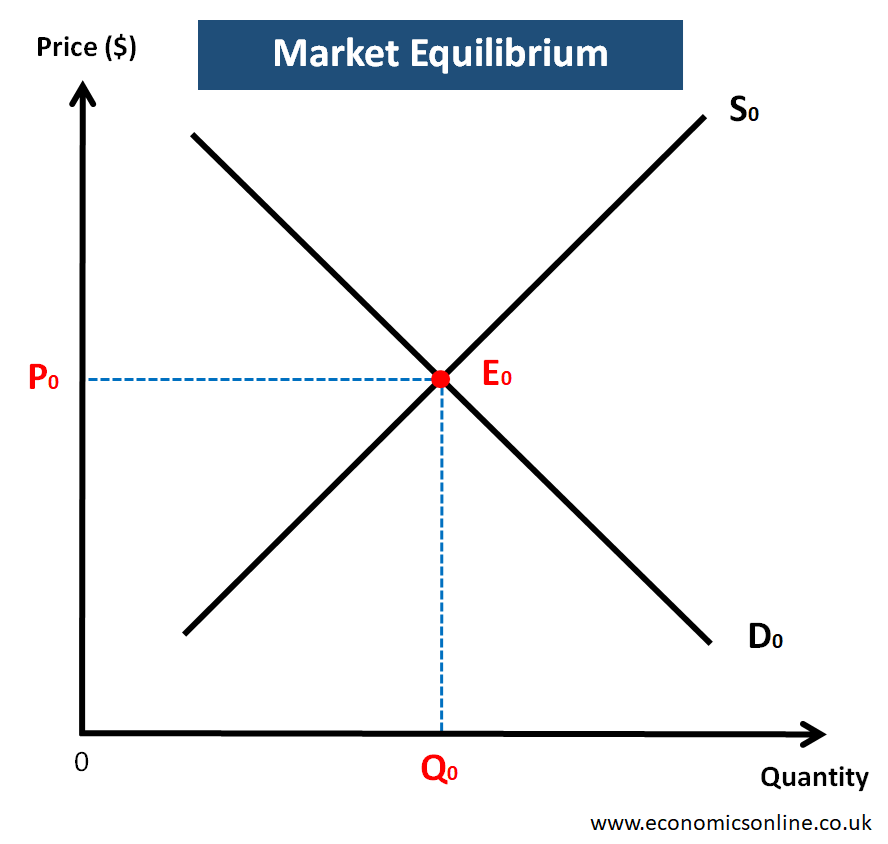
In the above diagram, the quantity is labelled on the horizontal axis (x-axis) and the price is on the vertical axis (y-axis). D0 is the downward sloping demand curve depicting the negative or inverse relationship between the price of the product and the quantity demanded, according to the law of demand. This demand curve represents buyers. When price is decreased, consumers are willing to buy more units of the product. But when price is increased, the quantity demanded decreases. S0 is the upward sloping supply curve depicting the positive or direct relationship between the price of the product and the quantity supplied, according to the law of supply model. This supply curve represents sellers. When the price increases, sellers are willing to sell more units of the product. But when price is increased, the quantity demanded decreases. The interaction between buyers and sellers is illustrated by the intersection of the supply and demand curves at point E0, which shows market equilibrium. At this point E0, where the two curves on the diagram cross, buyers and sellers agree to get the trade done. The equilibrium price is P0 and the equilibrium quantity is Q0. This equilibrium price is the only price for which equilibrium quantity is acceptable for both buyers and sellers.
For market equilibrium, economists assume the ceteris paribus condition, which means that the non-price factors are taken to be constant. However, market equilibrium is changed due to changes in non-price factors. The non-price factors affecting demand are called demand shifters, while those non-price factors affecting supply are called supply shifters. Some of the demand shifters are, the income of consumers, advertising expenses of firms, consumer tastes, price of substitutes, price of complements, and prices of substitutes or complements, interest rate, population, and season. Some of the supply shifters are, tax, fuel cost, labour cost, interest rate, bad weather, subsidies, good weather, or heavy rains, number of firms, and subsidy. Due to the demand shift or supply shift, a new equilibrium point, a new equilibrium price, and a new equilibrium quantity will be determined, and the market will no longer operate at initial equilibrium values.
Equilibrium Price
A price for which the quantity demanded of a product is equal to the quantity supplied is called the equilibrium price or market clearing price. At equilibrium price, the market is in equilibrium and there is no shortage or surplus.
Market Disequilibrium
Market disequilibrium refers to a situation of a market when quantity demanded is not equal to quantity supplied and there is either a shortage or a surplus. There are two types of market disequilibrium:
Market Surplus
A market surplus or excess supply is a type of market disequilibrium when quantity demanded is less than quantity supplied. This oversupply occurs at a price which is higher than equilibrium price.
Market Shortage
A market shortage or excess demand is a type of market disequilibrium when the quantity demanded is greater than the quantity supplied. This undersupply occurs at a price which is lower than equilibrium price.
Disequilibrium Price
Any price for which the quantity demanded of a product is not equal to the quantity supplied is called the disequilibrium price. This price can be any price other than equilibrium price. At disequilibrium price, the market is not in equilibrium and there is either a shortage or a surplus.
The following diagrams illustrate two types of market disequilibrium:
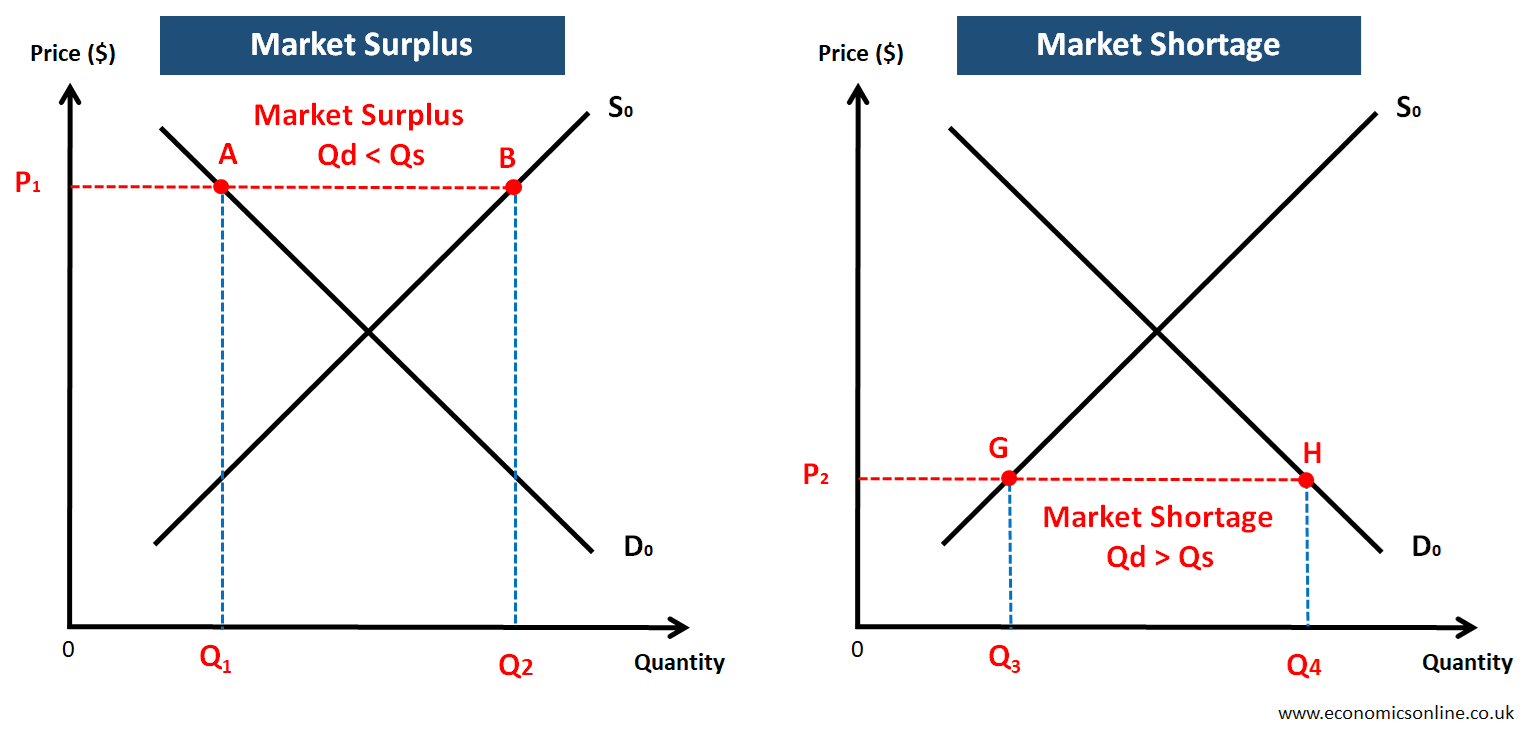
In the above diagram, the graph on the left illustrates market surplus or excess supply at price P1. At this price, P1, the quantity demanded is Q1, which is the amount consumers are able and willing to buy, while the quantity supplied is Q2, which is the amount producers are willing and able to sell. Since Q1 is less than Q2 (Qd<Qs), there is a market surplus that is graphically equal to AB or Q1Q2, as shown in the diagram. Due to this surplus, the price will decrease and the market will move towards equilibrium. The graph on the right illustrates market shortage or excess demand at price P2. At this price, the quantity supplied is Q3 and the quantity demanded is Q4, which is the amount of the product consumers would buy. Since Q3 is less than Q4 (Qd>Qs), there is a market shortage equal to GH or Q3Q4. This shortage affects the market price, which will increase, and the market will move towards equilibrium position.
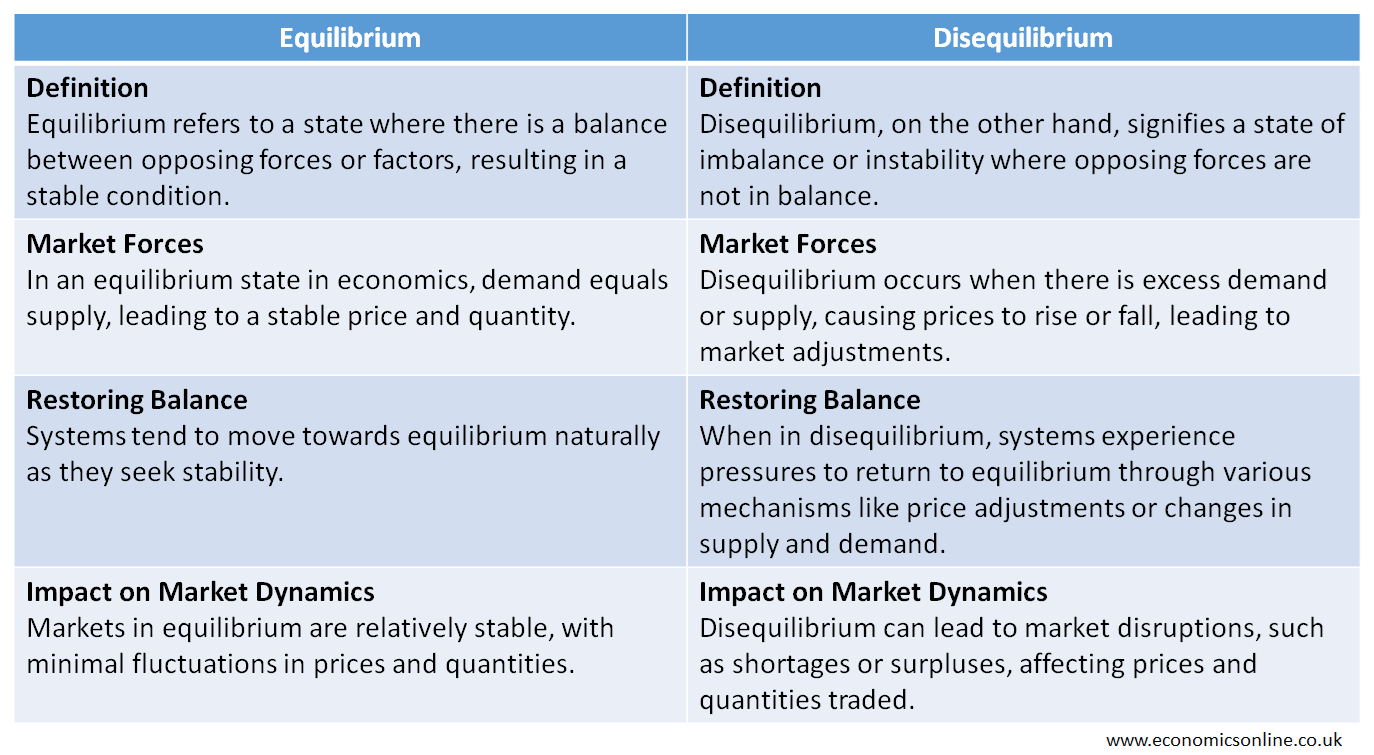
Differences between Equilibrium and Disequilibrium
The following table contains the main points of comparison between equilibrium and disequilibrium:
Importance of Equilibrium Quantity
Market equilibrium (equilibrium price and equilibrium quantity) is important in terms of creating stability in the market. For instance, when a market for a product is in equilibrium, this indicates stability in terms of the price of the product and the quantity traded. In this situation, there is no tendency for the market to move away from this equilibrium because the quantity demanded and the quantity supplied are equal. But when the market is not in equilibrium, the market forces try to restore equilibrium by moving towards equilibrium quantity and equilibrium price. This situation happens when supply is greater than market demand or demand is greater than market supply. This balance only happens when the market is in equilibrium. Moreover, the equilibrium quantity also shows the allocation of scarce resources for the production of the product.
Equilibrium Quantity and Efficiency
Economic efficiency means that the free markets are successful in allocating resources in a socially desirable way without any government intervention. This will maximise society's welfare. In free markets, the forces of demand and supply determine the equilibrium price and quantity. This equilibrium quantity shows the use of resources for the production of the product. Market equilibrium is not an indicator of market efficiency or economic efficiency. Similarly, equilibrium quantity does not always mean efficient resource allocation. It means that when a market is in equilibrium, resource allocation may or may not be economically efficient. This is due to the possibility of market failures, which arise when free markets don’t allocate resources in socially desirable ways. The equilibrium quantity will represent economically efficient resource allocation only in cases of perfect competition, due to the economic pressures of intense competition. In imperfect markets of monopolies or oligopolies, market failures occur, which make the equilibrium quantity economically inefficient.
Conclusion
In the end, equilibrium quantity is the amount of a product that belongs to the equilibrium price. Due to equilibrium quantity, there is no shortage or surplus of a product in the market. Both supply and demand intersect each other to maintain a state of equilibrium. Equilibrium quantity indicates a balance in the market and is not a necessary condition for economic efficiency.