An image showing choice.
Marginal Rate of Substitution (MRS)
What is the Marginal Rate of Substitution?
The marginal rate of substitution (MRS) is the quantity of one good that a consumer must sacrifice in order to increase the consumption of another good by one unit while maintaining the same level of total satisfaction.
It is the slope of the negative sloping indifference curve and is an important tool to understand consumer behaviour.
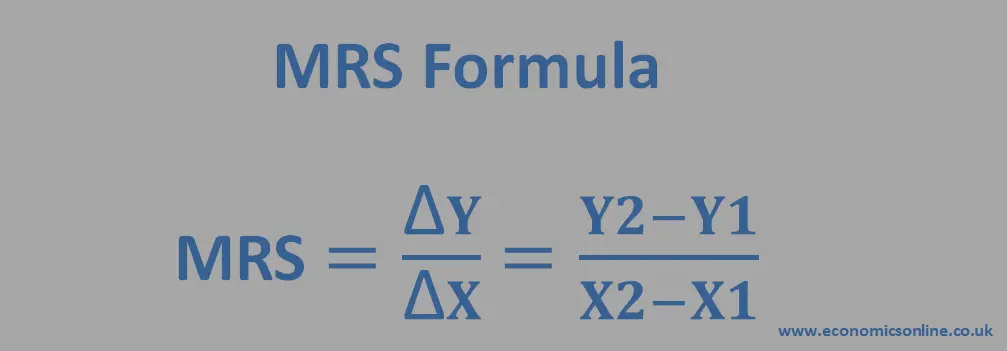
MRS Formula
The marginal rate of substitution formula can be expressed as:
MRS = (Change in the quantity of Good X / Change in the quantity of Good Y)

Calculation Example
Suppose a consumer is willing to give up three units of Good X for one unit of Good Y while maintaining the same level of total satisfaction. In that case, the MRS would be 3.
Marginal Rate of Substitution and the Indifference Curves
Indifference Curve
An indifference curve is a curve that shows possible combinations of two goods that a consumer can consume to get the same total satisfaction. Hence, the consumer will be indifferent.
The assumption here is that the consumer is rational.
Graphical Representation
The MRS is represented by the slope of the indifference curve.
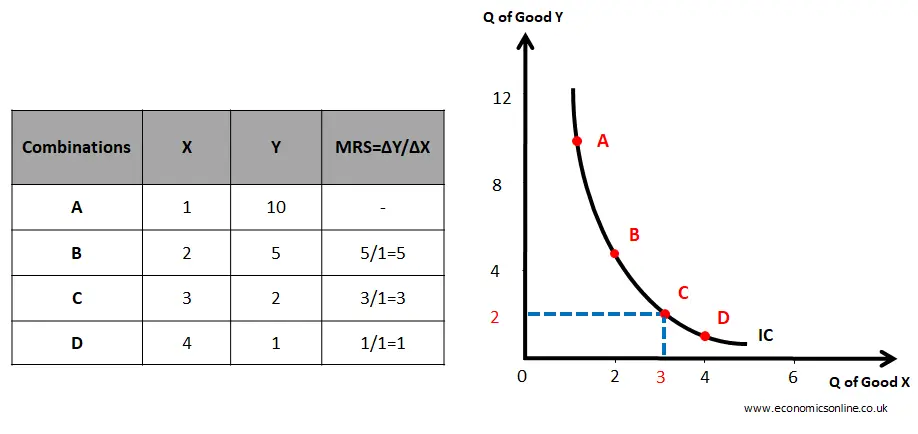
Let’s consider the following data table and graph.

Let's take the example of a consumer who has a choice between two substitute goods: X and Y. Each axis of the graph represents the quantity of one good. The X-axis (horizontal axis) shows the quantity of good X and the Y-axis (vertical axis) shows the quantity of good Y. The consumer's preferences can be represented by an indifference curve that shows all possible combinations of X and Y that yield the same level of satisfaction. The slope of the indifference curve at any point represents the MRS between the two goods at that point.
As shown in the above data table and standard convex shaped curve, each point on the indifference curve represents a combination of two goods that yields the same level of total utility or total satisfaction to the consumer. Points A, B, C, and D give the same total utility. So the consumer is indifferent.
- All the points on the same indifference curve give the same total utility.
- All points below an indifference curve show inferior combinations because they give lower total utility.
- All points above an indifference curve show superior combinations because they give higher total utility.
The last column of the above table shows the marginal rate of substitution, which is decreasing.
The indifference curve is bowed inward (convex to the origin) because of the decreasing marginal rate of substitution (MRS). The diminishing marginal rate of substitution is due to the law of diminishing marginal utility.
For example, suppose the consumer is initially consuming 1 unit of good X and 10 units of good Y, represented by point A on the indifference curve. If the consumer gives up 5 units of good Y and gets 1 more unit of good X, he/she would be at point B on the indifference curve, where the level of satisfaction is the same as at point A. The slope of the indifference curve at point B (the MRS between X and Y at point B) represents the rate at which the consumer is willing to substitute X for Y.
The slope of the indifference curve is steeper at point B than at point C, which indicates that the consumer is willing to give up more units of Y at point B for an additional unit of good X, and the MRS is higher at point B (5) than at point C (3).
From point A to point B, MRS = 5, which means that five units of good Y give the same utility as the second unit of good X. Hence, the second unit of good X is equal to five units of good Y in terms of utility.
From Point B to Point C, MRS = 3, which means that three units of good Y give the same utility as the third unit of good X. Hence, the third unit of good X is equal to three units of good Y in terms of utility.
From Point C to D, MRS = 1, which means that 1 unit of good Y gives the same utility as the fourth unit of good X. Hence, the fourth unit of good X is equal to one unit of good Y in terms of utility.
The value of 1 unit of X decreases with an increase in its quantity. This is according to the law of diminishing marginal utility. Due to this reason, MRS decreases, and the indifference curve is bowing inward. MRS will be constant for perfect substitutes, and the indifference curve will be a straight line.
The Importance of Marginal Rate of Substitution
MRS is an important concept in economics because it helps us understand how consumers make trade-offs between goods. By understanding MRS, economists can make predictions about how consumers will react to changes in prices or incomes.
Limitations of Marginal Rate of Substitution
MRS has some limitations. One limitation is that it assumes that the consumer has perfect information and can make rational decisions. However, in reality, consumers may not always have perfect information and may make irrational decisions.
Conclusion
The marginal rate of substitution analysis is an important concept in microeconomics that helps us understand how consumers make trade-offs between goods. Despite its limitations, MRS remains an essential tool for understanding consumer behavior and decision-making in economics.


