
An image showing a developed country with pollution.
The Kuznets Curve
Definition
The Kuznets curve is a graphical representation of the relationship between economic growth and income inequality.
It is a hypothetical inverted U-shaped curve that illustrates that with increasing GDP per capita (economic growth), countries initially experience increasing income inequality, but later on, the income inequality decreases.
Origin
The Kuznets curve is named after its creator, Simon Kuznets, an American economist who first introduced the concept in 1950s and 1960s. Kuznets was a Nobel laureate in economics and made significant contributions to the fields of economic growth and income inequality.
Graph of the Kuznets Curve
The following diagram shows the graph of a typical inverted U-shaped Kuznets curve.
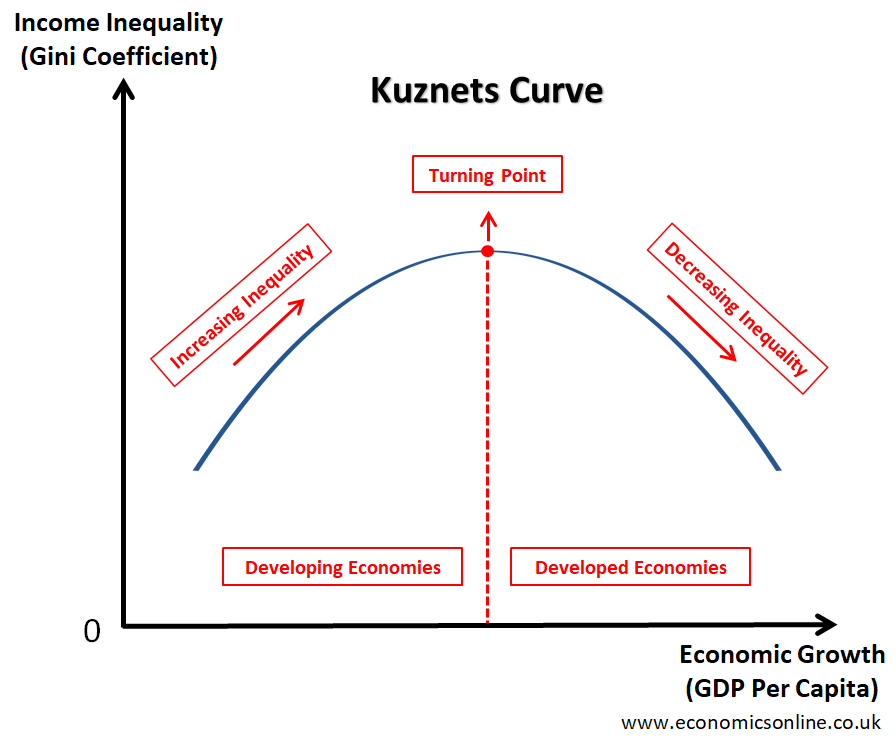
The horizontal axis (x-axis) represents economic growth in terms of gross domestic product (GDP) per capita. The vertical axis (y-axis) represents the level of income inequality, which is measured using the Gini coefficient. Let’s explain the Kuznets curve in four parts:
1. The Starting Point
The starting point of the Kuznets curve shows low income inequality in a country with low GDP per capita. This is because poor economies with a dominant agricultural sector often have a more equal distribution of income among individuals.
2. The Upward Slope
The upward sloping part of the Kuznets curve illustrates that as economies experience economic growth and progress from agricultural economies to industrialised ones, income inequality starts to increase.
This is because, with greater economic activity, new investment opportunities increase for those who already have the capital to invest. This means that those who already have wealth have the opportunity to increase it. There is also an influx of inexpensive rural labour to the cities (urbanisation), which keeps wages down for the working class because of an increase in labour supply (higher urban population ). This widens the gap between the rich and the poor, leading to an increase in income inequality.
So, the initial increase in income inequality can be attributed to factors such as the concentration of wealth in the hands of a few individuals or groups, the unequal distribution of resources, and urbanisation.
3. The Turning Point
The turning point shown on the Kuznets curve graph represents maximum income inequality. This turning point occurs at a certain level of per capita income and is usually referred to as the "Kuznets threshold," where income inequality reaches its peak. This turning point can occur at different levels of economic growth in different countries.
4. The Downward Slope
After the turning point, the downward sloping part of the Kuznets curve illustrates that income inequality decreases with a further increase in GDP per capita. This happens when deindustrialisation occurs along with an increase in the service sector. Income inequality begins to decline as the benefits of economic growth gradually trickle down to lower-income groups. This can be due to factors such as increased access to education, progressive taxation, and social welfare programmes run by governments.
Hence, the downward sloping part of the Kuznets curve illustrates that income inequality eventually starts diminishing as economies continue to progress, leading to a more equitable distribution of income.
Empirical Evidence
Many studies have examined the validity of the Kuznets curve across different countries and time periods. While findings are not universally consistent, empirical evidence supports the general idea that economic inequality, especially in European countries, tends to rise during the early stages of economic growth and then decline.
The Significance of the Kuznets Curve
The Kuznets curve is an important tool that offers policymakers valuable insights into the relationship between economic growth and income inequality. By understanding this curve, governments can design policies to achieve an important macroeconomic objective of low income inequality. Such policies may include investments in education and skills to enhance human capital, progressive taxation, social welfare programmes, and labour market regulation.
Environmental Kuznets Curve
The Environmental Kuznets Curve (EKC) shows the relationship between environmental degradation and economic growth. The graph of EKC is also an inverted U-curve and is shown below.
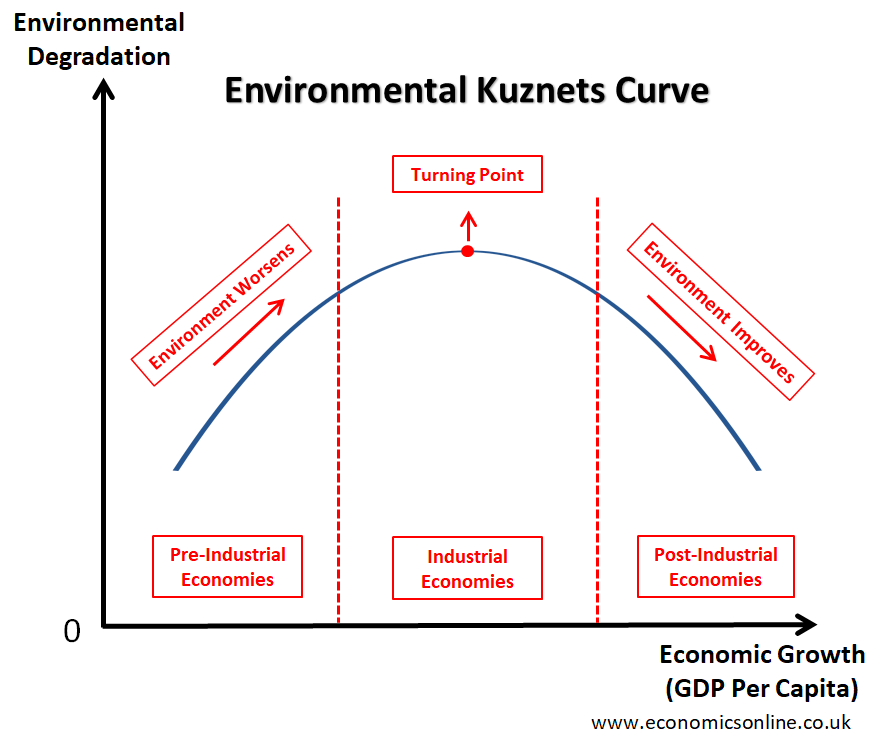
The horizontal axis (x-axis) represents economic growth in terms of gross domestic product (GDP) per capita. The vertical axis (y-axis) represents the level of environmental degradation or pollution (environmental damage).
Initially, as countries experience rapid industrialization and economic growth, environmental pollution tends to worsen. However, as countries develop and become more aware of environmental concerns, environmental degradation decreases because of deindustrialisation (decrease in manufacturing), green environmental policies, sustainable development, environmental protection, renewable energy sourcing, environmental regulations, and environmentally friendly technologies.
Hence, environmental degradation starts to decline eventually in post-industrial developed economies with a dominant service sector.
Criticism
Mixed Empirical Evidence
Empirical results about the relationships illustrated by the Kuznets curve are mixed. For example, the Kuznets curve does not explain the rise in income inequality in some developed economies, such as the UK.
Oversimplification
The Kuznets’ hypothesis assumes a simple and linear relationship between economic growth and income inequality. However, the real world is complex, and the said relationship can be influenced by many other economic, social, and political factors.
Time Lag
The Kuznets curve suggests that income inequality will eventually decrease over time as a result of economic growth. However, it does not account for the potential time lag between economic growth and the realisation of decreased income inequality. In certain cases, income inequalities can persist for extended periods despite economic growth.
Economic Landscape
The Kuznets curve was developed during a time when industrialisation was the main form of economic growth and development. However, the economic landscape has changed now, and income inequalities can be influenced by factors such as automation, globalisation, and the gig economy, which were not covered by the Kuznets curve.
Conclusion
The Kuznets curve suggests that with economic growth, income distribution becomes more uneven, and then after a certain income level, income becomes more evenly distributed. The environmental Kuznets curve illustrates the EKC hypothesis, which is a relationship between environmental degradation and economic growth. Both Kuznets curves have similar shapes. The Kuznets curve has offered valuable insights into the dynamics of income inequality and economic development. Despite its limitations, the Kuznets curve provides a framework for policymakers to address income disparities. Furthermore, the emerging concept of the environmental Kuznets curve reinforces the need for sustainable development while protecting environmental quality.