
An image showing USD.
The Money Market Graph and Interest Rate Determination
Money
Money refers to anything that is generally accepted as a medium of exchange.
Types of Money
Narrow Money (M0)
Narrow money is the total amount of money in an economy, either in the form of notes and coins or held as reserves by commercial banks.
M0 = Notes + Coins + Bank Reserves
Bank reserves refer to the money kept by commercial banks in the central bank for settling debts between each other and drawing out cash when needed.
Broad Money (M4)
Broad money includes narrow money and other types of deposits.
M4 = M0 + Bank Reserves + Other Deposits
Other deposits include checking account deposits and savings account deposits.
The Money Market
The money market is like any other market where the forces of demand and supply of money determine the interest rate or the price of money.
Interest Rate
The cost of borrowing money, expressed as a percentage of the amount of the loan, is called the interest rate. In other words, the interest rate is the amount paid by the borrower to the lender for the use of the borrowed money, expressed as a percentage of the principal amount.
Types of Interest Rates
Nominal Interest Rate
The interest rate measured at current year prices, which includes inflation, is called the nominal interest rate.
Real Interest Rate
The interest rate measured at base year prices and adjusted for inflation is called the "real interest rate."
Real Interest Rate = Nominal Interest Rate - Rate of Inflation
Theories of Interest Rate Determination
There are two theories regarding the working of the money market and the determination of the interest rate.
- Loanable Funds Theory
- Liquidity Preference Theory
Here we will explain the liquidity preference theory.
Liquidity Preference Theory
It is the Keynesian theory of interest rate determination.
Liquidity
The ease or speed with which an asset can be converted into cash. Cash and bank deposits are highly liquid assets.
In liquidity preference theory, the interest rate is determined by
- The demand for money (MD) or liquidity preference (LP)
- The supply of money (MS)
Assumptions
- People and firms hold all their wealth in two ways: cash and bonds.
- The financial institutions are well established.
- The money supply is fixed.
- The same interest rate is charged for all types of financial assets.
- Money demand for transactionary and precautionary motives is perfectly interest-inelastic.
- Everyone speculates.
The Demand for Money (MD) or Liquidity Preference (LP)
The willingness of people and firms to hold cash (prefer liquidity) is called liquidity preference (LP). This is also called demand for money (MD).
The demand for money, or liquidity preference is because of three motives.
- Transactionary Motive
- Precautionary Motive
- Speculative Motive
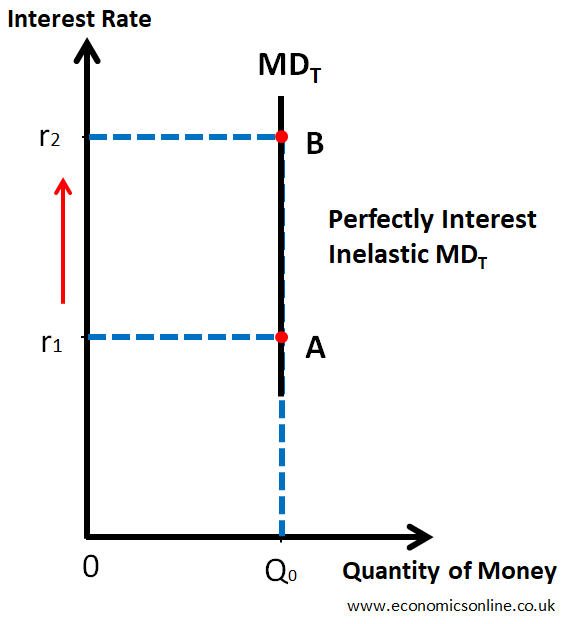
Demand for Money for Transactionary Motive (MDT)
People and firms hold cash (prefer liquidity) for transactionary motives. Cash is needed for day-to-day transactions, as money is the medium of exchange.
- Households need cash to buy food, clothing, and pay bills.
- Firms need cash to buy raw materials, pay wages, etc.
- The government needs cash to meet the daily expenditures of government offices.
MDT is perfectly interest-inelastic as shown by the following graph.
Determinants of MDT
1. Level of Income
- If income is increased, MDT will increase.
- If income decreases, MDT will decrease.
2. Inflation
If the general price level increases, MDT will increase as more cash will be needed to buy the same quantity of goods and services.
3. Income Intervals
If income intervals increase, MDT will increase because more cash will be needed to make transactions for a longer period of time.
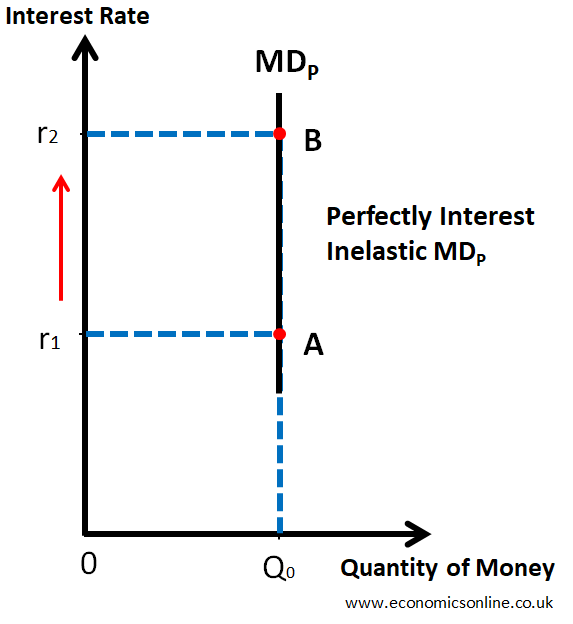
Demand for Money for Precautionary Motive (MDP)
People hold cash (prefer liquidity) for future uncertainties (precautionary motive).
Households keep cash for loss of job, theft, accidents, unexpected family expenses, illness, etc.
Firms keep cash for fire, theft, accidents, breakdown of machinery, losses, etc.
MDP is perfectly interest-inelastic as shown by the following graph.
Determinants of MDP
1. Uncertainty
- High uncertainty means a higher MDP.
- Low uncertainty means a lower MDP.
2. Level of Income
- If income is increased, MDP will increase.
- If income decreases, MDP will decrease.
3. Inflation
If general price level increases, MDP will also increase as more cash will be needed for future uncertainties.
Demand for Money for Speculative Motive (MDS)
- Speculation means the purchase of an asset for short-term gain due to the difference between its sale price and purchase price.
- Assumption of liquidity preference theory is that people will hold only two forms of assets i.e. cash and bonds.
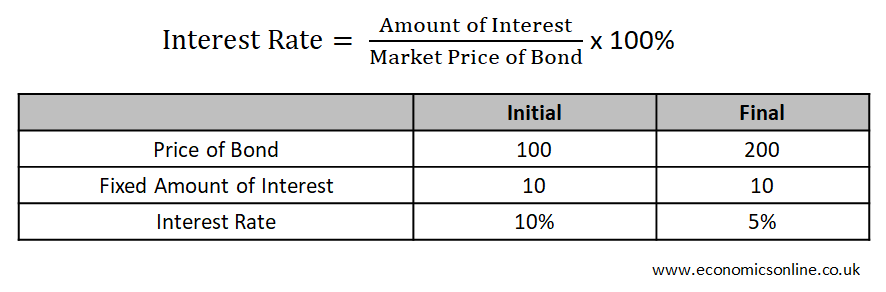
- Bonds are certificates issued by government at discounted rate (i.e., less than their face value) for a long period of time (usually more than one year) and they have fixed amount of interest per annum regardless of their market price.
- There is an inverse relationship between the price of bonds and the interest rate in the bond markets as shown by the following table.
Demand for Money for Speculative Motive (MDS)
Money demand for speculative motive and its relationship with interest rate is shown by the following graph.
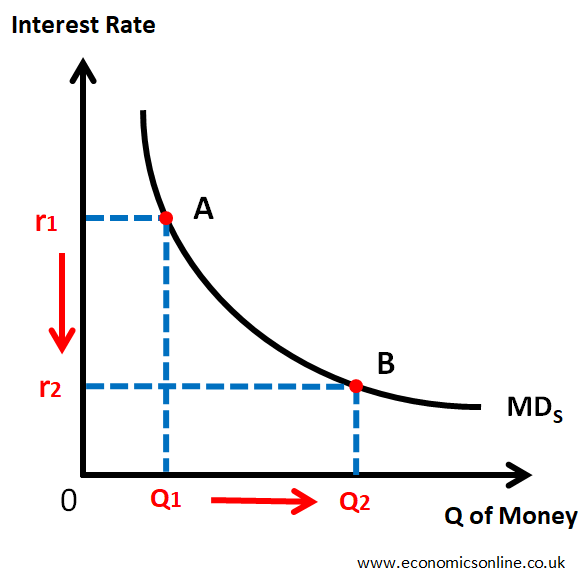
- When Interest Rate is high (r1),
- Price of Bond will be low and
- There will be high opportunity cost of holding cash.
- So, people will buy bonds and they will hold less cash.
- So MDS will be low (Q1).
- When Interest Rate is low (r2),
- Price of Bond will be high and
- There will be low opportunity cost of holding cash.
- So, people will sell bonds and they will hold more cash.
- So MDS will be high (Q2).
MDS is interest-elastic.
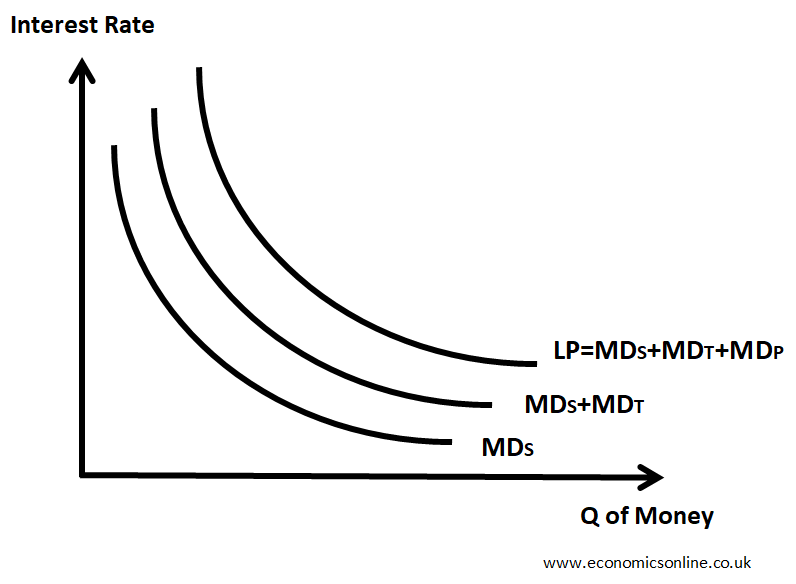
Total Demand of Money or Liquidity Preference (LP)
LP = MDT + MDP + MDS
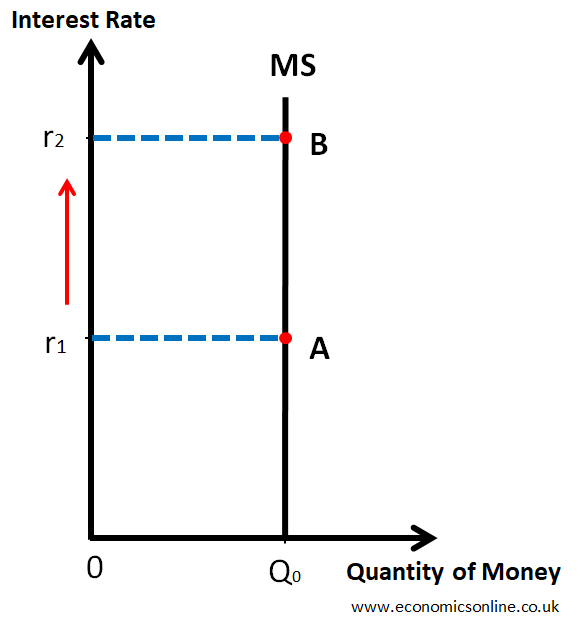
Supply of Money (MS)
In liquidity preference theory, the supply of money is assumed to be fixed because it is controlled by the central bank. The verical money supply curve is shown below.
Equilibrium Interest Rate
It is an interest rate for which LP = MS and there is no tendency to change. r0 is the equilibrium interest rate where LP and MS curves intersectas shown by the following graph. The quanity of money is on the horizontal axis and the interest rate is on the vertical axis.
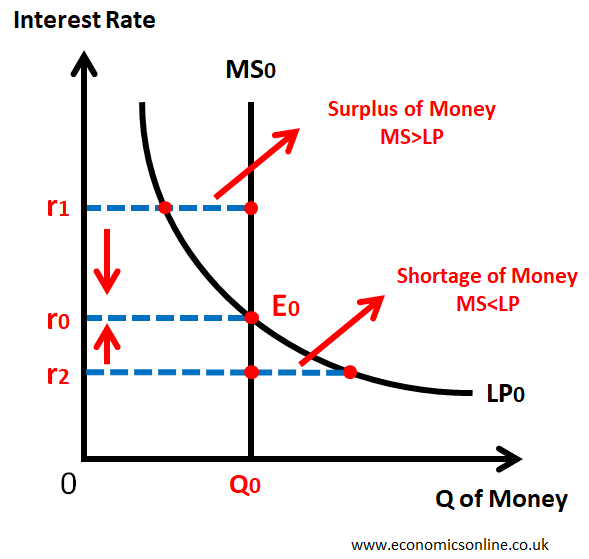
At higher interest rate r1: MS>LP => there is a surplus of cash => the buying of bonds will increase => the demand for bonds will increase => the price of bonds will increase => the interest rate will decrease and the equilibrium will be restored.
At lower interest rate r2: MS<LP => there is a shortage of cash => the selling of bonds will increase => the supply of bonds will increase => the price of bonds will decrease => the interest rate will increase and the equilibrium will be restored.
At r0: MS=LP => there is no shortage or surplus of cash => no change in buying or selling of bonds => no change in the bond prices => no tendency for equilibrium interest rate to change. bonds => no change in the bond prices => no tendency for equilibrium interest rate to change. This is money market equilibrium.
Changes in Equilibrium Interest Rate
Changes in Equilibrium Interest Rate can be due to
- Shift in the demand for money or liquidity preference (LP)
- Shift in the supply of money (MS)
- The simultaneous shift in the demand for money and the supply of money.
Some of the cases of changes in the equilibrium interest rate are shown below.
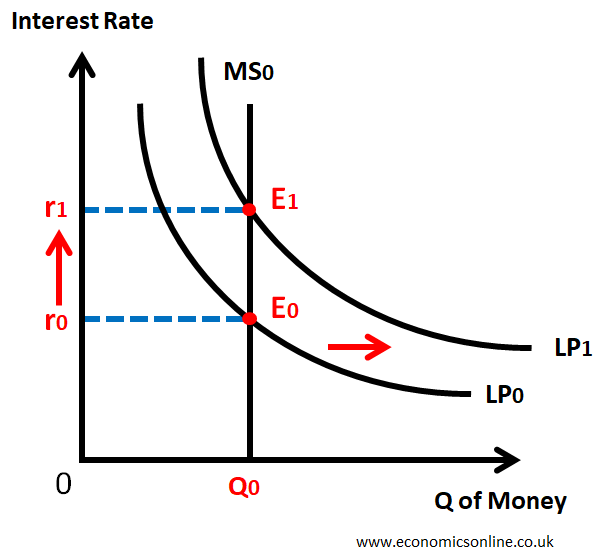
This graph illustrates the change in the equilibrium interest rate due to the rightward shift of the money demand curve. When the money demand curve shifts to the right, the interest rate increases due to increased demand for money.
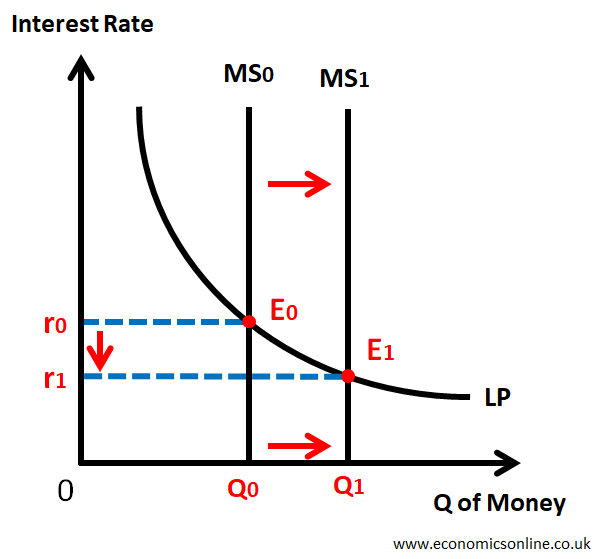
This graph illustrats the change in the equilibrium interest rate due to the rightward shift of money supply curve.
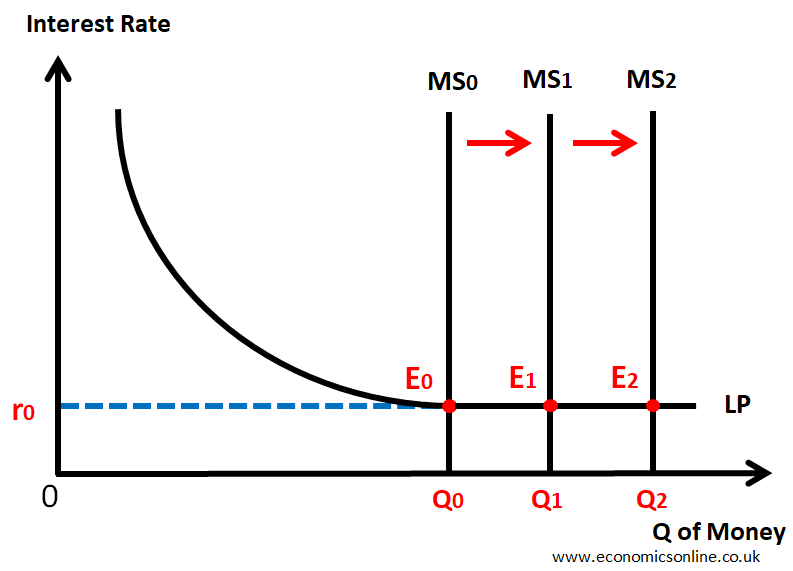
Liquidity Trap
A situation when increase in the money supply (MS) has no effect on interest rate is called Liquidity Trap.
Normally, an increase in the money supply will cause interest rate to fall.
But at low interest rate, liquidity preference (LP) becomes perfectly interest elastic and increase in money supply (MS) has no effect on interest rate.
Keynes described this situation as Liquidity Trap.
It occurs when
- The interest rate is very low, and
- The price of bonds is very high.
This is shown by the following graph.
Limitations of Liquidity Preference Theory
- People and firms do not hold all their wealth in two ways, i.e., cash and bonds.
- In less developed countries, financial institutions are not well established.
- The money supply is fixed only in the short run. In the long run, the mooney supply changes.
- The same interest rate is not charged for all types of financial assets.
- Money demand for transactionary and precautionary motives is not perfectly interest inelastic specially at high interest rates
- Everyone does not speculate.