
An image showing the harvest of apple.
Understanding the Supply Shifters
What are the Supply Shifters?
In economics, the supply shifters are the non-price factors that affect the quantity of a good that suppliers are willing and able to sell at a given price.
There are many non-price factors affecting the supply of a product, and in this article, we will explore them in detail. But first, let’s define some basic terms.
Basic Terms
Supply
The willingness and ability of suppliers to sell different quantities of a good at various prices in a given time period, ceteris paribus, is called supply. Here, ceteris paribus is a Latin phrase which means that all non-price factors are assumed to be constant. This is called a ceteris paribus assumption.
Quantity Supplied
The willingness and ability of suppliers to sell a specific quantity of a good at a specific price in a given time period, ceteris paribus, is called quantity supplied. In simple words, the quantity supplied is the number of units of a good that suppliers are willing and able to sell at a specific price in a given time period, ceteris paribus.
Supply refers to the whole supply schedule and does not change when the price of the product changes. A change in the price of a good causes a change in its quantity supplied, while, a change in any non-price factor causes a change in supply.
The Law of Supply
The law of supply states that an increase in the price of a good will lead to an increase in its quantity supplied by firms and vice versa, ceteris paribus. This law explains the positive or direct relationship between the price of a good and its quantity supplied, ceteris paribus.
The Supply Schedule
The supply schedule is a table that shows the positive relationship between the price of a good and its quantity supplied, ceteris paribus. Consider the following simple supply schedule:
|
P ($) |
Quantity Supplied |
|
10 |
100 |
|
20 |
200 |
In the above supply schedule, the left column shows an increase in price, while, the right column shows a corresponding increase in the quantity supplied of a product. This shows the positive or direct relationship between the price of a product and its quantity supplied, ceteris paribus.
The Supply Curve
The supply curve is a curve that shows a positive relationship between the price of a good and its quantity supplied, ceteris paribus. It is the graphical representation of the supply schedule. The following graph illustrates the supply curve based on the data in the above table.
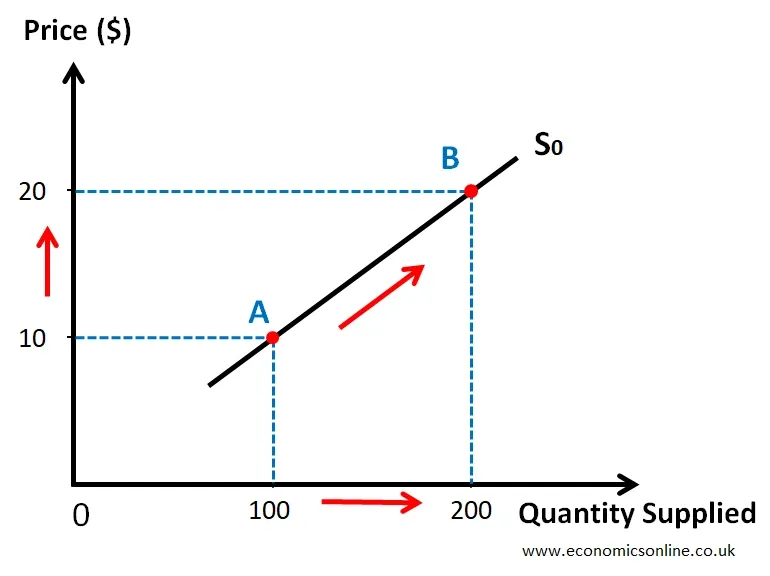
In the above supply curve, we have taken the quantity supplied of a good on the X-axis (horizontal axis) and the price on the Y-axis (vertical axis). The upward sloping supply curve S0 shows the positive relationship between the price of a good and its quantity supplied, ceteris paribus.
The Determinants of Supply
There are two types of factors affecting the supply of a good. These are also called the determinants of supply.
Price
The change in the price of a good causes a change in its quantity supplied (not supply). There is movement along the same supply curve from one point to another when the price changes. For example, in the above graph of the supply curve, when the price is increased from $10 to $20, the quantity supplied is increased from 100 units to 200 units, and there is a movement from point A to point B along the same supply curve S0.
Non-price Factors (The Supply Shifters)
There are many non-price determinants of supply. The change in any non-price factors causes the change in supply. There is a shift of the whole supply curve from one position to another due to any change in any non-price factor.
Let’s take the example of the cost of production, which is a non-price factor affecting supply.
Let’s consider the following table:
|
P ($) |
Qs (High Cost) |
Qs (Low Cost) |
|
10 |
100 |
200 |
|
20 |
200 |
300 |
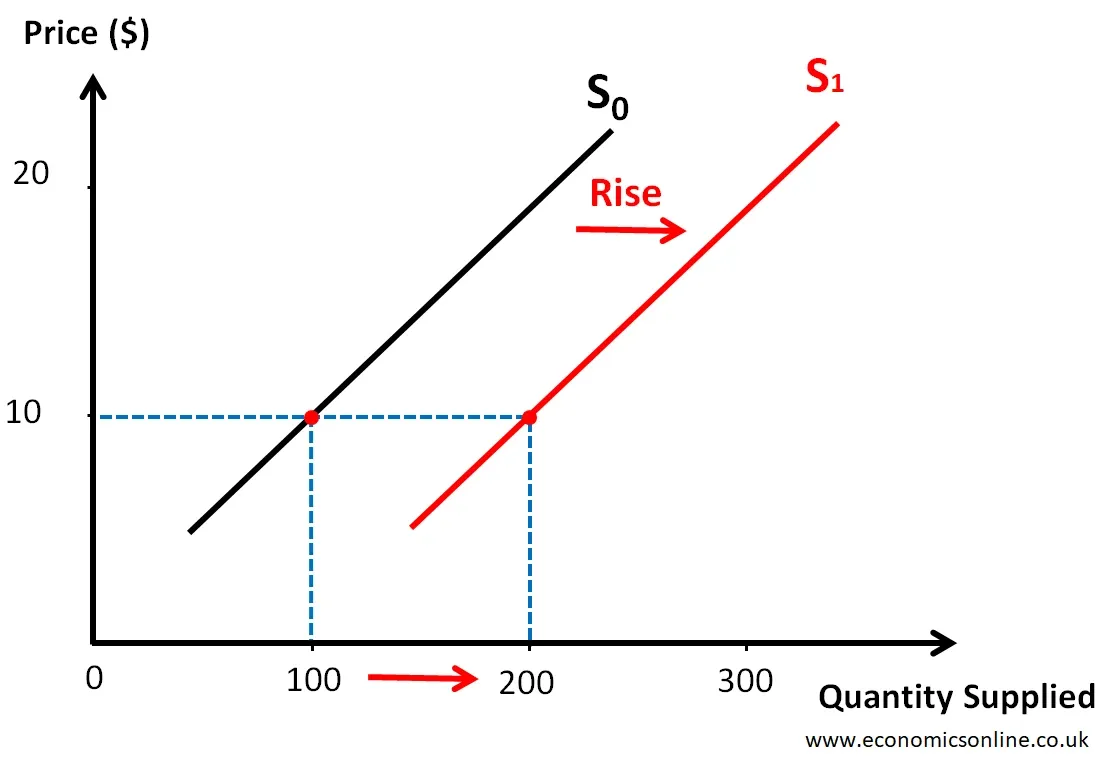
When the cost of production decreases, there is an increase in the quantity supplied at all prices. This means that the whole supply schedule has changed. The supply curve will shift towards the right from S0 (the original supply curve) to S1 (the final supply curve), as shown in the following graph.
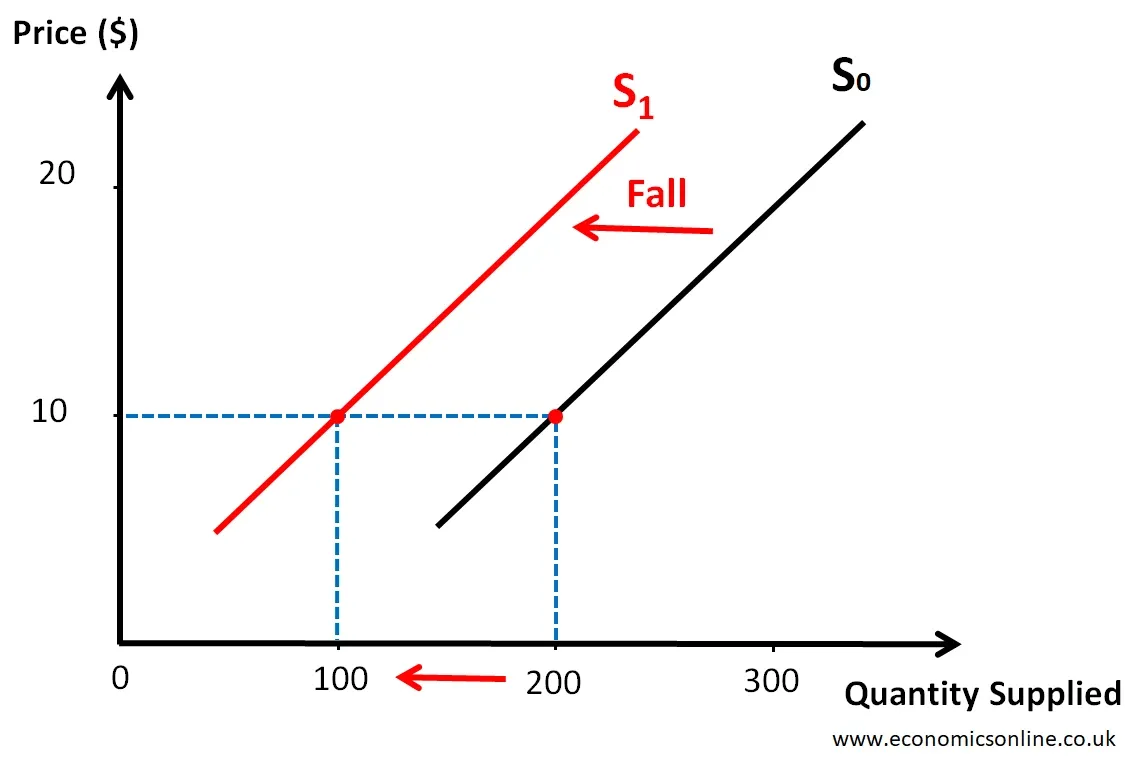
Similarly, when the cost of production increases, there is a lower quantity is supplied at all prices. This means that the whole supply schedule is changed, as shown in the following table.
|
P ($) |
Qs (Low Cost) |
Qs (High Cost) |
|
10 |
200 |
100 |
|
20 |
300 |
200 |
The supply curve will shift towards left from S0 (the original supply curve) to S1 (the final supply curve), as shown in the following graph.
Major Supply Shifters
The following table shows a summary of the major supply shifters and their effects on the supply.
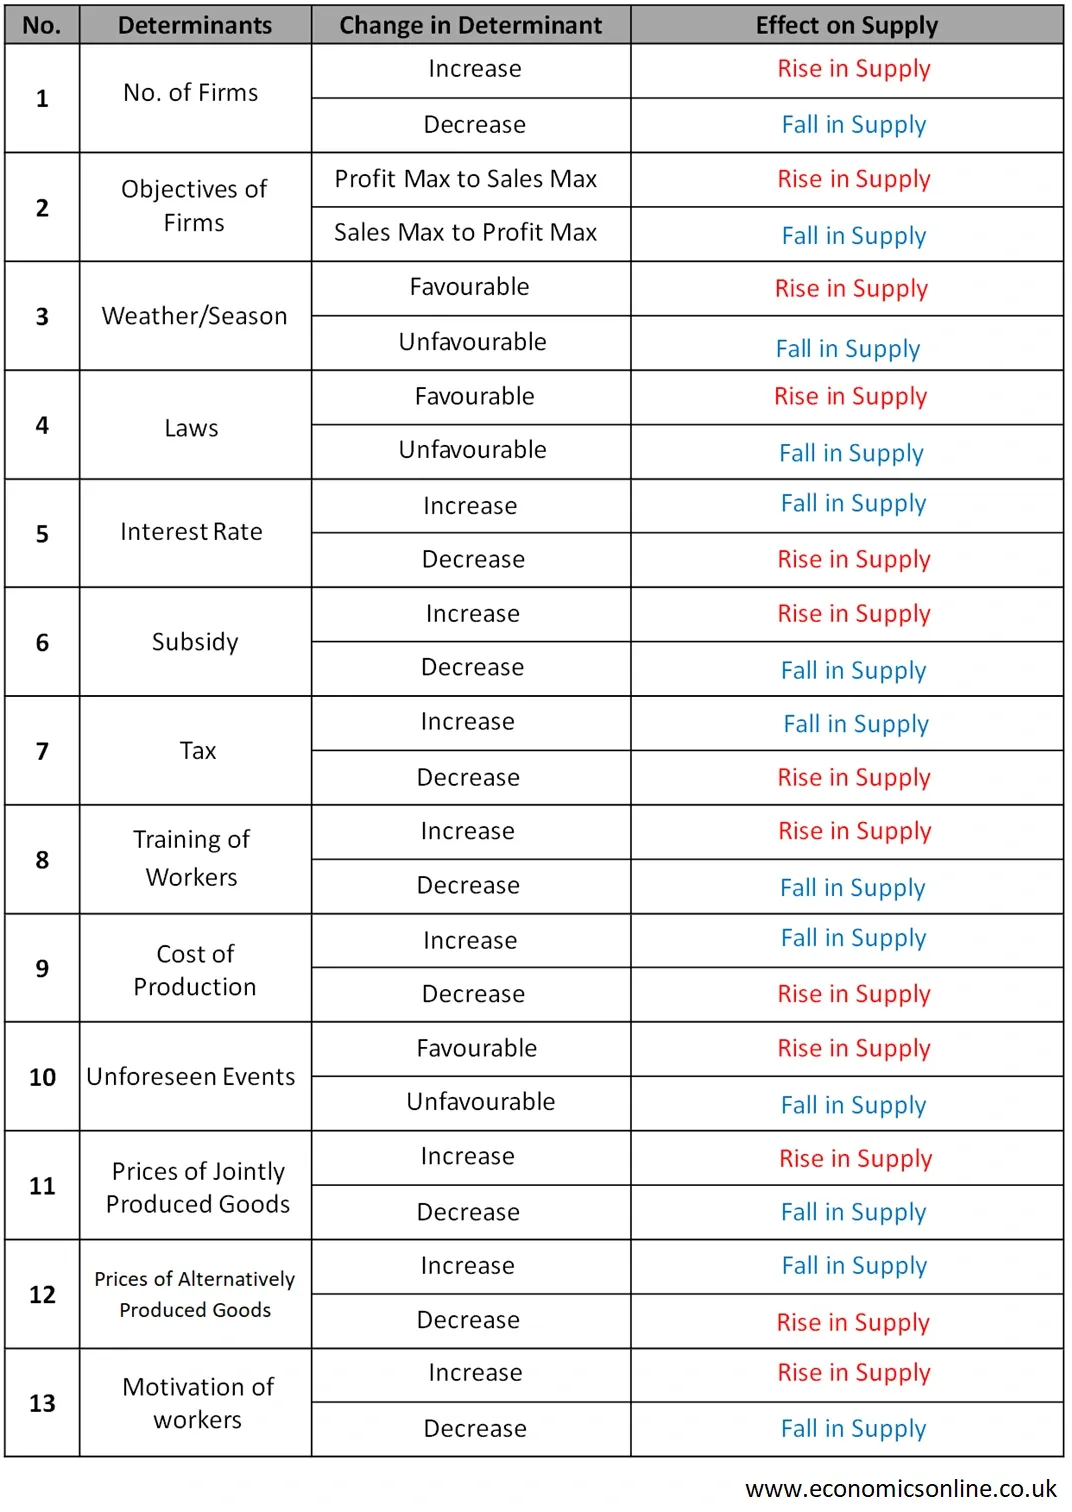
Let’s explain some of the supply shifters in detail.
Production Costs
The cost of producing a good or service is one of the most significant supply shifters. For many types of firms, labour costs are an important item. In other firms, the cost of energy or transport may be more important, or the productivity of workers can have a huge impact on costs. If the cost of production increases, firms will have to increase the price of their products in order to maintain profitability. This results in a decrease in the quantity of a good supplied at every price, causing a leftward shift of the supply curve. Conversely, a decrease in production costs will result in an increase in the quantity of a good supplied, leading to a rightward shift of the supply curve.
Technology
Technology can also be a significant factor that affects the supply of goods and services. Technological improvement, new technology or technological innovations can lead to more efficient production methods and lower costs, which increase the quantity of a good supplied. This results in a rightward shift in the supply curve. On the other hand, if a technology becomes outdated or inefficient, it can increase the cost of production, leading to a decrease in the quantity of a good supplied and a leftward shift of the supply curve.
Taxes and Subsidies
Taxes and subsidies can have a significant impact on the supply of goods and services. If the government imposes a tax on a good or service, the cost of production increases, causing a leftward shift in the supply curve. Conversely, if the government provides a subsidy, firms can reduce their costs of production, leading to a rightward shift of the supply curve.
Number of Suppliers
The number of sellers in a market can also affect the quantity of a good supplied. An increase in the number of suppliers in a market will increase the quantity of a good supplied at every price level, leading to a rightward shift of the supply curve. Conversely, a decrease in the number of suppliers will lead to a decrease in the quantity of a good supplied and a leftward shift of the supply curve.
Weather
The supply of agricultural products is always affected by uncertain weather conditions. Storms or frost may affect the supply of coffee or grapes; drought affects cereal crop yields (a leftward shift); whereas good weather can help farmers get bumper harvests of corn and wheat (a rightward shift).
Conclusion
Supply shifters is an important concept in economics, and by understanding supply shifters, we can understand the behaviour of firms supplying a good in the market and hence its impact on the price of that good. The concept of supply shifters can help firms make better decisions about production, pricing, and strategic planning.