The Labour market
The Labour market
Estimates by the ONS in 2018 put the size of the UK labour force at 33.8m workers out of an estimated population of 66.1m. In 2018 (December), those in work totalled 32.48m , with unemployment at 1.38m.
The labour market includes the supply of labour by households and the demand for labour by firms. Wages represent the price of labour, which provide an income to households and represent a cost to firms. In a hypothetical free market economy, wages are determined by the unregulated interaction of demand and supply. However, in real mixed economies, governments and trade unions can exert an influence on wage levels.
Nominal and real nominal wages
Nominal wages are the money wages paid to labour in a given period of time. Real wages are nominal wages, adjusted to take into account changes in the price level. Most workers expect at least an annual increase in their money wages to reflect price increases, and so maintain their real wages.
The demand for labour
The main factors affecting the demand for labour are:
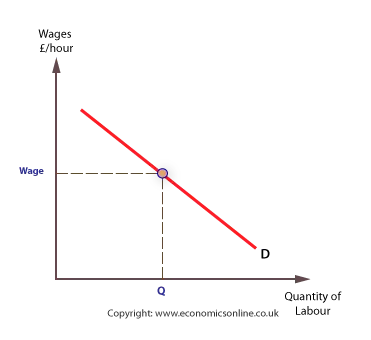
The wage rate
The higher the wage rate, the lower the demand for labour. Hence, the demand for labour curve slopes downwards. As in all markets, a downward sloping demand curve can be explained by reference to the income and substitution effects.
At higher wages, firms look to substitute capital for labour, or cheaper labour for the relatively expensive labour. In addition, if firms carry on using the same quantity of labour, their labour costs will rise and their income (profits) will fall. For both reasons, demand for labour will fall as wages rise.
The demand for the products
The demand for labour is a derived demand, which means it is ultimately based on demand for the product that labour makes. If consumers want more of a particular good or service, more firms will want the workers that make the product.
Productivity of labour
Productivity means output per worker, and If workers are more productive, they will be in greater demand. Productivity is influenced by skill levels, education and training, and the use of technology.
Profitability of firms
If firms are profitable, they can afford to employ more workers. In contrast, falling profitability is likely to reduce the demand for labour.
Substitutes
The extent to which labour is indispensable also affects the demand. If substitutes, such as capital machinery, become cheaper or more expensive, the demand curve for labour will shift to the left or right. For example, if the price of new technology falls there may be a reduction in demand for labour.
The number of ‘buyers’ of labour
The number of buyers in a market can influence total demand in a given market. A single buyer in a market is called a monopsonist, and these are relatively common in labour markets. For example, London Underground is the only firm in the UK to employ underground tube drivers. In general, when a labour market is dominated by one employer the demand for labour is less than if there are many employers. In addition, there is a tendency for the wage rate to be lower in such markets, which is one reason why trade unions form, and exert pressure for higher wages.
The supply of labour
The labour supply is defined as the number of workers willing and able to work, multiplied by the hours they are willing and able to work. It is determined by:
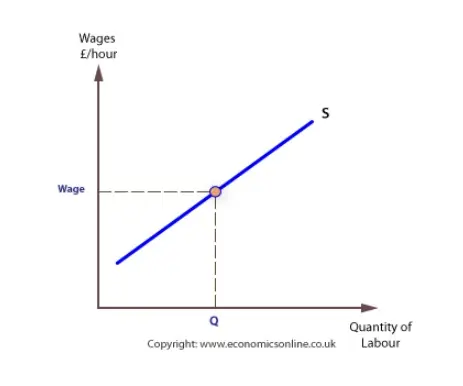
The wage rate
The higher the wage rate, the more labour is supplied, which means the supply curve of labour will slope upwards. A worker’s wage, along with any bonus, provides the main pecuniary (monetary) benefit from working.
Factors other than wages will shift the supply curve to the left or right. These factors include:
The size of the working population
The working population is the number of people of working age (16 – 60 for women and 16 – 65 for men) who are willing and able to work. The size of the working population is influenced by the retirement and school leaving ages, migration, and numbers staying on at University.
Migration
Migration can have a considerable impact on the labour market. Migrants tend to be of working age, and while the general effect is to increase the supply of labour at all wage rates, migration especially affects supply at lower wage rates. This is because migrants tend to come from low wage economies, with average wages often far below the minimum wage in the UK.
People’s preferences for work
If people prefer more work, the supply of labour increases. Preferences can be influenced by a range of factors including changes in the ‘cost’ of working, such a subsidised childcare, and non-wage benefits (advantages) of working.
Net advantages of work
As well as the wage rate, decisions to increase or decrease labour supply are influenced by non-monetary (non-pecuniary) advantages, such as changes in working conditions, job security, holiday entitlement, promotion prospects, and other pyschological benefits of work. Improvements in these benefits will shift the labour supply curve to the right.
Work and leisure
For many, part-time work is an increasingly attractive option given the advantages of increased leisure. Early retirement is also a factor affecting labour supply.
An individual’s decision to supply labour is greatly affected by the choice between work and leisure. Given that time is fixed, work and leisure are substitutes for each other.
The choice between work and leisure can be affected by a number of factors, including:
- Age – older workers often gain more utility from leisure.
- Direct taxes – higher income tax rates may increase the utility of leisure and reduce the labour supply.
- Dependents – having children may increase the utility of work, and increase the labour supply.
- Non-work income – some individuals can retire from the labour market because they have company pensions which may be received before state pensions, which are available for men at 65 and women at 60. Non-work income can come in the form of cash benefits, such as the Job Seeker’s Allowance, and benefits-in-kind, such as subsidised travel cards.
Individual labour supply
The supply curve for an individual cannot continue to slope upwards indefinitely. Labour market theory suggests the labour supply curve will initially slope upwards, and then bend backwards. Up to a wage rate of W1 in the diagram, the relative price of leisure for an individual increases and workers will look to switch from leisure to work. In other words, there is a strong substitution effect as wages start to rise. Hence, the supply curve slopes upwards to point L.
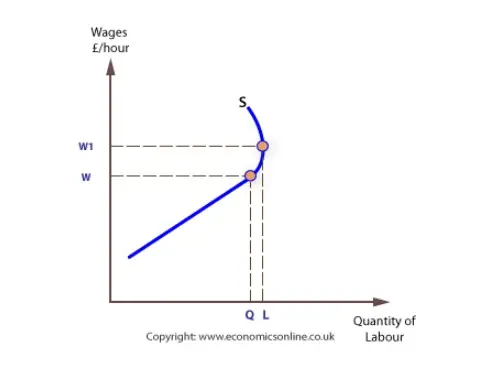
However, beyond W1, the income effect begins to dominate and further rises in money wages, which boost real income, mean that less work is required to achieve the same level of real income. It can be assumed that beyond a given wage a worker will be satisfied with their level of real income, hence wage rates beyond this level means that fewer hours need to be worked. However, few workers are in a position to be able to reduce their hours given that they have fixed contracts.
Barriers to entry
Barriers to entry into the labour market, such as the strict requirement for qualifications, will make the supply of labour less than it would be with no barriers.
Trade Unions
A trade union is an organisation that aims to protect the interests of workers. Around 30% of UK employees are members of unions, with women more likely to be in a union than men. Union membership has fallen steadily over the last 20 years.
Unions can affect the supply of labour in three ways.
- Firstly, unions can attract workers into the labour market because of the benefits of becoming a member. This will shift the supply curve to the right.
- Secondly, unions exert control over the labour supply and can withdraw labour by limiting working hours or going on strike. A strike will shift the supply curve of labour to the left.
- Thirdly, by influencing wages through collective bargaining the supply curve for unionised workers is more inelastic than one for non-unionised workers.
Go to: Unite – The UK’s largest trade union
Tax and benefit incentives and disincentives
Tax and benefit rates can lead to increases and decreases in the effective labour supply. When income taxes are excessive and benefits too generous, a stay-at-home culture may be encouraged.
Labour subsidies
If the government gives a subsidy to workers to look for work, or to train, then the supply of labour will increase, and the supply curve will shift to the right.
The actual and potential labour supply
The actual labour supply includes those workers who are both willing and able to supply their labour, including the unemployed. The potential labour supply also includes those who, for one reason or another, are currently inactive.
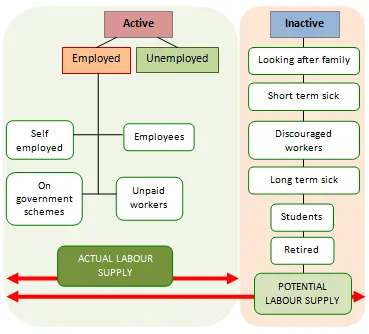
SOURCE: WWW.STATISTICS.GOV
The equilibrium wage rate
The market wage, or market clearing wage rate, is the wage that brings the demand and supply of labour into equilibrium.

The equilibrium wage rate can change following changes in the demand or supply of labour, such as:
Labour productivity
An increase in labour productivity will shift the demand curve to the right, and increase employment (Q to Q1) and increase the wage rate wage rate (W to W1).

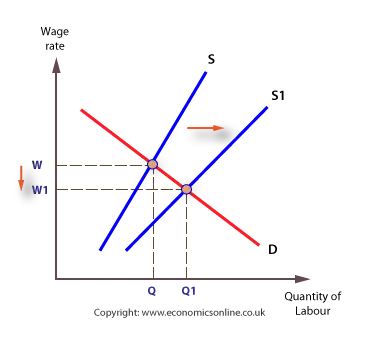
Preference for work
An increase in people’s preference for work will shift the supply curve to the right, and increase employment (Q to Q10) but it would also reduce the wage rate (W to W1). Similarly, an increase in the net advantages of work will shift the supply curve to the right.
Trade union activity
If a trade union withdraws labour through a strike, the supply curve of labour will shift to the left, and the wage rate rises. However, the level of employment falls, from Q to Q1.

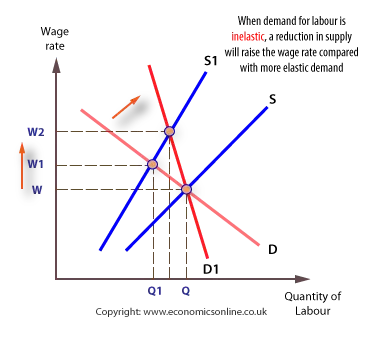
The importance of elasticity
The effect on the wage rate and level of employment of a shift in either the demand or supply of labour depends upon the elasticity of the other curve.
For example, if the demand for labour is very inelastic, perhaps because there are no substitutes for labour, the effect of a strike is to raise the wage rate, but leave employment largely unaffected. The result is that workers will gain as a group, even though some individual workers will lose their jobs.
Wage differentials
If labour markets are very competitive, with identical workers and perfect mobility of labour, wages will move towards the same equilibrium level. However, in reality wages can differ greatly, even for the same job. A variety of different factors account for this, including the following.
Human capital differences
Some jobs require lengthy training and education, and this is reflected in higher wages. Human capital is the quantity and quality of labour and human capital development is the process of improving the quality of labour through education and training.
Human capital development, through education and training, is a considerable cost to individuals and firms, both in terms of time spent and resources used. Firms are aware that they must compensate for human capital development to attract the necessary skilled labour they require. Airlines, for example, know that they must pay skilled pilots significantly more than semi-skilled cabin crew to compensate pilots for the greater sacrifice pilots make during their lengthy education and training. In contrast, airlines only need to pay a relatively low wage to unskilled cleaners because there is little education or training needed, and therefore, little human capital development.
Over time, market forces will adjust the cost and benefit of education and training so that labour shortages in one area push up the wage rate, and it becomes more worthwhile to train for jobs in these shortage areas.
Formal education
Formal education is an important determinant of human capital, and wages. Lifetime earnings vary directly with education and an individual who just obtains ‘A’ Levels, will earn much less, on average, than an individual with a university degree.
Wages and skills
The demand for skilled workers is greater than the demand for unskilled workers because the value of the output produced by skilled workers will be higher, and can command a higher price.
The marginal cost of acquiring a skill and improving human capital is greater, so the skilled worker’s supply curve is to the left of the unskilled worker. The combined effect of the higher demand and lower supply is that wages for skilled workers are often much higher that for unskilled workers.
Because of the greater human capital required, skilled workers expect a higher wage to encourage them to supply more labour.

The widening pay gap
In the UK, the gap between the earnings of skilled and unskilled workers has risen in recent years, mainly for two reasons:
- Technological change and the new economy have increased the productivity of many skilled workers. The application of IT is often more possible in skilled occupations compared with unskilled ones.
- International trade and globalisation have had a significant downward impact on the pay of the unskilled. In contrast, the skilled, especially those in the service sector, are generally less adversely effected by global competition. The recent financial crisis has meant that the financial services sector has experienced difficulties in terms of pay, but the skills gap and resultant pay gap is unlikely to narrow in any significant way.
Discrimination
Wage levels can also be affected by job discrimination, which means that groups of worker are denied access, or have limited access, to jobs or to higher paid (elite) jobs. Workers can suffer discrimination because of their:
- Gender
- Race
- Disability
- Age
Discrimination is considered a labour market failure, and its effect is to reduce the supply of labour into a given profession, and drive up the pay of the elite workers. This leads to a relative increase in supply of workers available for the non-elite jobs and depresses their wages. Wage differentials can, therefore, be sustained by the practice of discrimination.
Gender and pay
Despite equal pay legislation, gender still affects wage rates. Even though the pay gap between men and women is closing, women still earn approximately 75 – 80% of the level of men.
Factors that might account for this gap include:
- Possible differences in the level of human capital development, especially formal education because women may invest less in their own human capital development than men.
- There may be productivity differences (in manual work), although this is clearly a minor factor in a service sector economy.
- The number of hours worked, and career breaks will affect labour productivity. On average, women work fewer hours than men (35 hours per week, for women and 40 hours for men. It is estimated that this alone contributes around 12.5% of the difference). (Source: OECD)
- Women are often crowded into low-paid jobs, with low skill levels.
- Women are also often crowded into part-time jobs, with lower pay relative to full-time employees.
- In contrast, women are often crowded out of higher paid jobs through discrimination, or are discriminated against in terms of promotion. Females often make up a very small percentage of senior jobs.
Female pay as a percentage of male pay has been rising over the last 15 years. Despite the differences that still exist, the gap between male and female pay is narrowing.
Possible explanations for this include:
- The human capital of females is catching up with that of males because female performance in formal education has improved. Girls achieve higher GCSE and ‘A’ level grades and are rapidly catching up in terms of degree performance.
- A decline in the impact of discrimination, due to the gradual impact of the Equal Pay Act, 1970, and other legislation.
- More females are becoming employers, and this reduces the likelihood of discrimination.
- Government support for equal opportunities initiatives, such as Opportunity 2000 (now called Opportunity Now.)
- The growth of the service sector and decline in the manufacturing sector has also contributed to a narrowing of the pay gap. Changes in the structure of the economy may have benefited females in relation to males. The growth of the service sector has led to a relative increase in demand for service sector workers, which has also increased wages in parts of the service sector in comparison with declining relative wages in the manufacturing sector.
- The introduction of the national minimum wage in 1997 had a proportionately bigger effect on female wages, compared with male wages.
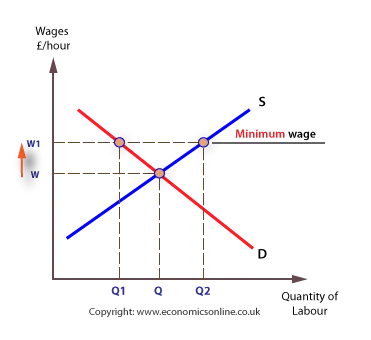
The national minimum wage
The government can also influence the wage rate by setting a national minimum wage.
The effect is that demand contracts from Q to Q1 and supply extends from Q to Q2 creating a surplus of labour.