
Demand for labour
The labour market
Estimates by the ONS in 2018 put the size of the UK labour force at 33.8m workers out of an estimated population of 66.1m. In 2018 (December), those in work totalled 32.48m , with unemployment at 1.38m.
The labour market includes the supply of labour by households and the demand for labour by firms. Wages represent the price of labour, which provide an income to households and represent a cost to firms. In a hypothetical free market economy, wages are determined by the unregulated interaction of demand and supply. However, in real mixed economies, governments and trade unions can exert an influence on wage levels.
Nominal and real nominal wages
Nominal wages are the money wages paid to labour in a given period of time. Real wages are nominal wages, adjusted to take into account changes in the price level. Most workers expect at least an annual increase in their money wages to reflect price increases, and so maintain their real wages.
The demand for labour
The main factors affecting the demand for labour are:
The wage rate
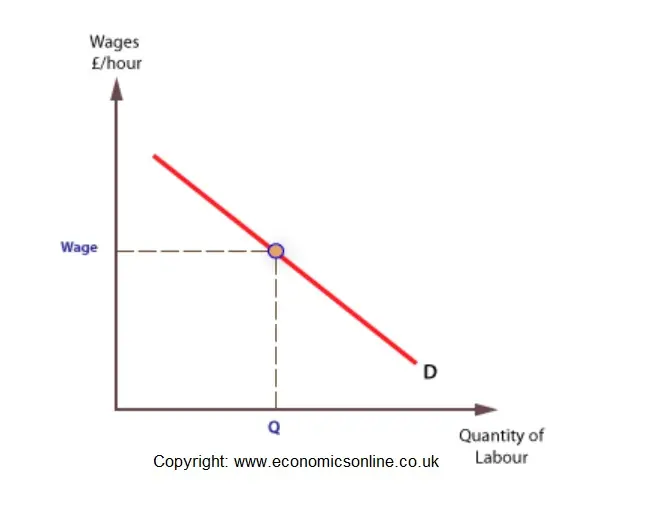
The higher the wage rate, the lower the demand for labour. Hence, the demand for labour curve slopes downwards. As in all markets, a downward sloping demand curve can be explained by reference to the income and substitution effects.
At higher wages, firms look to substitute capital for labour, or cheaper labour for the relatively expensive labour. In addition, if firms carry on using the same quantity of labour, their labour costs will rise and their income (profits) will fall. For both reasons, demand for labour will fall as wages rise.
Marginal productivity
The demand for labour, and other factors of production, is derived from the demand for the products these factors make. For example, if mobile phones are in greater demand, then the demand for workers in the mobile phone industry will increase, ceteris paribus.
The demand for labour will vary inversely with the wage rate. To understand this we need to consider the law of diminishing returns. This states that if a firm employs more of a variable factor, such as labour, assuming one factor remains fixed, the additional return to extra workers will begin to diminish. To explore this process, we need to consider the total physical product (output) produced by a series of workers, which will enable us to measure the individual output from each additional worker – the marginal physical product (MPP).
Consider the following data for a small firm producing handmade wax candles.
| Workers | Total physical product | Marginal physical product |
| 1 | 1000 | |
| 2 | 1900 | 900 |
| 3 | 2700 | 800 |
| 4 | 3400 | 700 |
| 5 | 4000 | 600 |
| 6 | 4500 | 500 |
| 7 | 4900 | 400 |
| 8 | 5200 | 300 |
Demand is based on the value to the firm of the marginal physical product produced by each worker. For example, if candles are £2 each, the firm can calculate the revenue derived from each worker’s physical output. The value of the extra output is called marginal revenue product (MRP), and this is calculated by multiplying MPP and price, as follows:
| Workers | Total physical product | Marginal physical product | Marginal revenue product |
| 1 | 1000 | ||
| 2 | 1900 | 900 | 1800 |
| 3 | 2700 | 800 | 1600 |
| 4 | 3400 | 700 | 1400 |
| 5 | 4000 | 600 | 1200 |
| 6 | 4500 | 500 | 1000 |
| 7 | 4900 | 400 | 800 |
| 8 | 5200 | 300 | 600 |
Deriving a demand curve
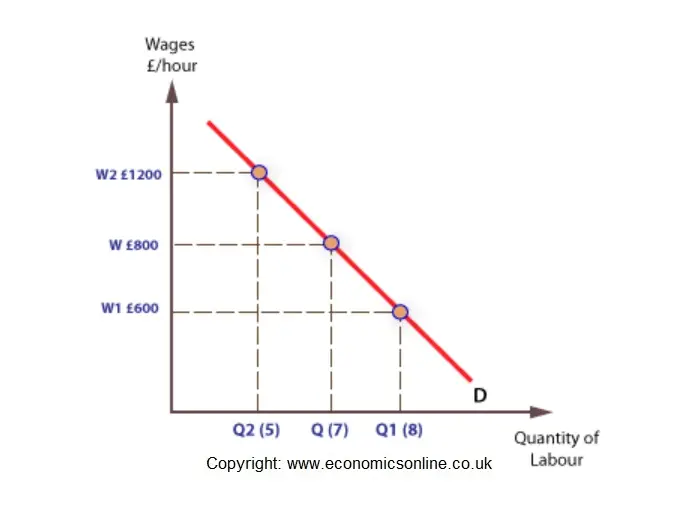
We can now find the number of workers that would be employed by a profit maximising firm at various wage rates. The profit maximising firm will employ workers up the point where the marginal benefit, in terms of the MRP, equals the marginal cost of labour (MCL), which in this case is the wage rate (W).
For example, at a wage rate of £1,200, the firm will employ 5 workers, because at 5 workers, MRP = MCL. At a lower wage of £800, the firm will employ 7 workers, and so on. This means that a demand curve can be derived. In labour market theory, the demand for labour is identified as MRP=D.
Other factors affecting the demand for labour include:
The demand for the products
The demand for labour is a derived demand, which means it is ultimately based on demand for the product that labour makes. If consumers want more of a particular good or service, more firms will want the workers that make the product.
Productivity of labour
Productivity means output per worker, and If workers are more productive, they will be in greater demand. Productivity is influenced by skill levels, education and training, and the use of technology.
Profitability of firms
If firms are profitable, they can afford to employ more workers. In contrast, falling profitability is likely to reduce the demand for labour.
Substitutes
The extent to which labour is indispensable also affects the demand. If substitutes, such as capital machinery, become cheaper or more expensive, the demand curve for labour will shift to the left or right. For example, if the price of new technology falls there may be a reduction in demand for labour.
The number of ‘buyers’ of labour
The number of buyers in a market can influence total demand in a given market. A single buyer in a market is called a monopsonist, and these are relatively common in labour markets. For example, London Underground is the only firm in the UK to employ underground tube drivers. In general, when a labour market is dominated by one employer the demand for labour is less than if there are many employers. In addition, there is a tendency for the wage rate to be lower in such markets, which is one reason why trade unions form, and exert pressure for higher wages.
Shifts in the demand for labour
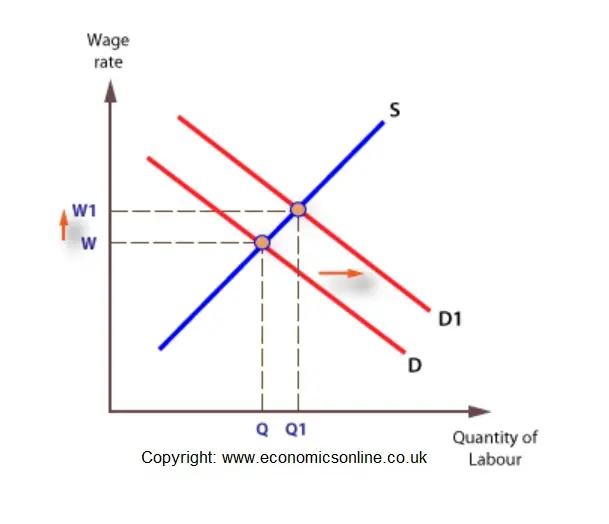
The demand curve for labour will shift following any change in a determinant of demand, other than the wage rate. If the wage rate changes there will be a movement along the existing demand curve.
Example of changes that can cause a shift in the demand curve include:
- Changes in the productivity of labour.
- Changes in the skill level of labour (hich also affects supply).
- Changes in the prices of the goods or services produced.
- An increase or decrease in the demand for goods or services.
- Changes in the prices of substitues, including technology.
Go to the supply of labour