Shifts in demand
The position of the demand curve will shift to the left or right following a change in an underlying determinant of demand.
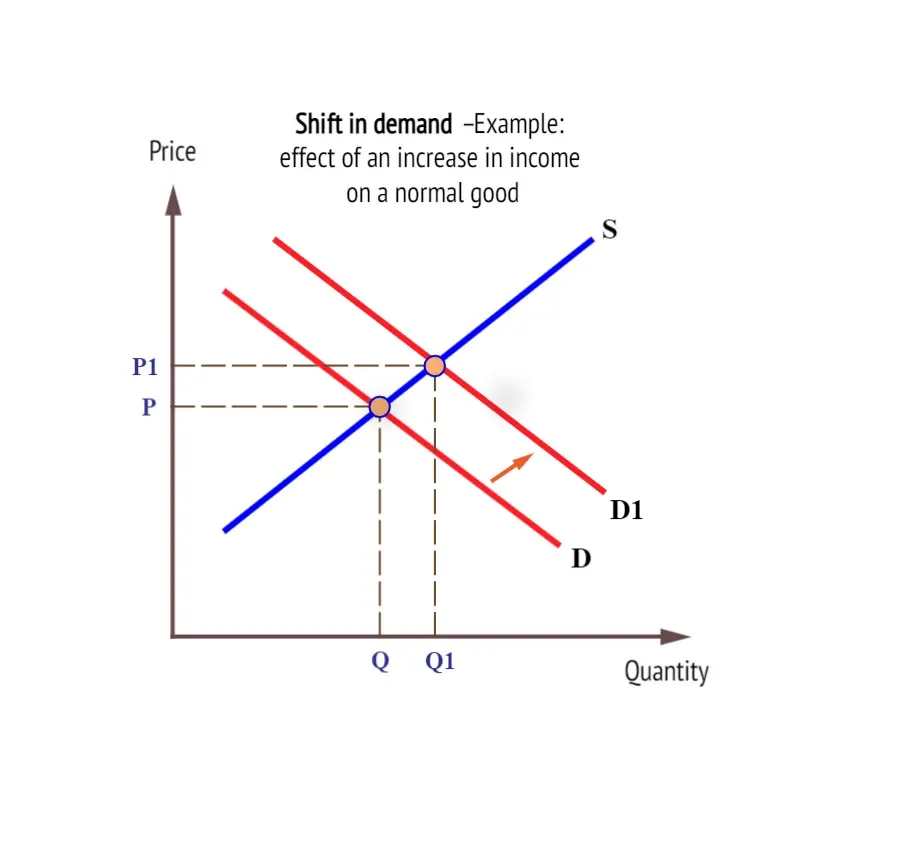
Increases in demand are shown by a shift to the right in the demand curve. This could be caused by a number of factors, including a rise in income, a rise in the price of a substitute or a fall in the price of a complement.
Demand schedule
A shift in demand to the right means an increase in the quantity demanded at every price. For example, if drinking cola becomes more fashionable demand will increase at every price.
| PRICE (£) | ORIGINAL Qd | NEW Qd |
| 1.10 | 0 | 100 |
| 1.00 | 100 | 200 |
| 90 | 200 | 300 |
| 80 | 300 | 400 |
| 70 | 400 | 500 |
| 60 | 500 | 600 |
| 50 | 600 | 700 |
| 40 | 700 | 800 |
| 30 | 800 | 900 |
Increases in demand
An increase in demand can be illustrated by a shift in the demand curve to the right.

Decreases in demand
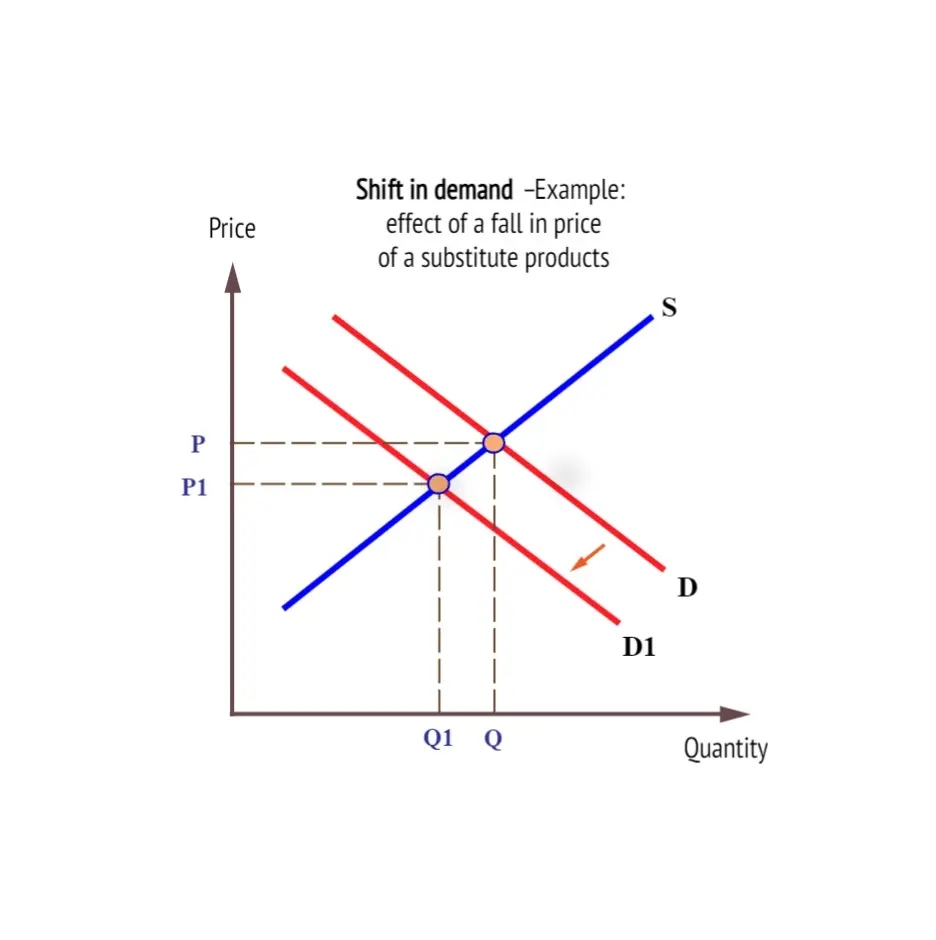
Conversely, demand can decrease and cause a shift to the left of the demand curve for a number of reasons, including a fall in income, assuming a good is a normal good, a fall in the price of a substitute and a rise in the price of a complement.
Demand schedule
For example, if the price of a substitute, such as fizzy orange, falls, then less cola is demanded at each price, as consumers switch to the substitute.
| PRICE (£) | ORIGINAL Qd | NEW Qd |
| 1.10 | 0 | |
| 1.00 | 100 | |
| 90 | 200 | 100 |
| 80 | 300 | 200 |
| 70 | 400 | 300 |
| 60 | 500 | 400 |
| 50 | 600 | 500 |
| 40 | 700 | 600 |
| 30 | 800 | 700 |
Decreases in demand are shown by a shift of the demand curve to the left.

Examples