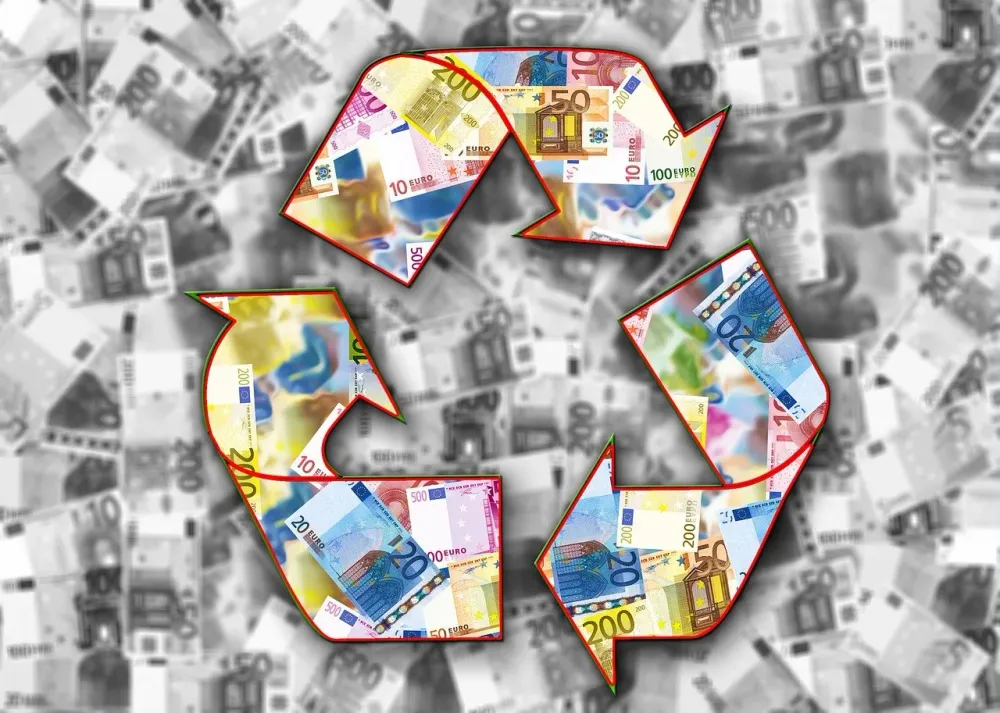
An image of money arrows showing a cycle.
Business Cycle Graph
Business Cycle Definition
The business cycle refers to the recurring pattern of economic growth and recession in a country over a period of time. It is also called the trade cycle or economic cycle.
What is Business Cycle Graph?
A business cycle graph is a graphical representation of the relationship between the real GDP of a country and time. This graph provides the visual representation of the fluctuations in economic activity in a country. This graph is shown below.
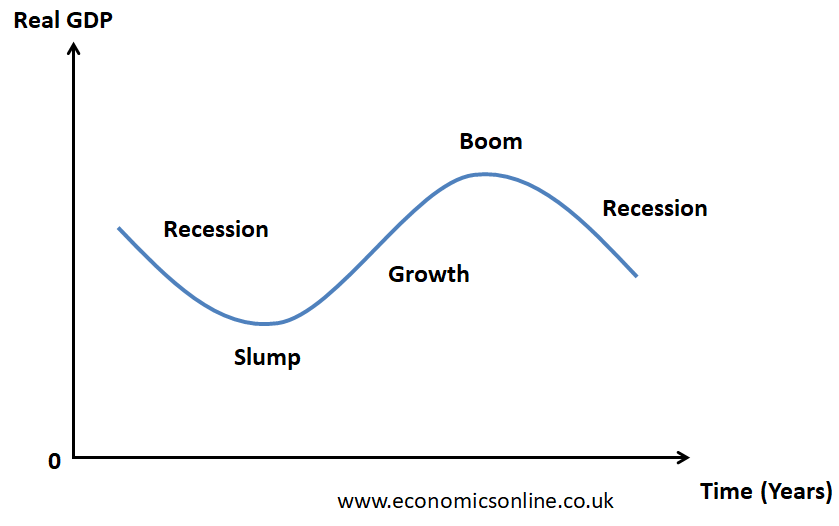
In the above graph, time is taken on the X-axis, while, the real gross domestic product (real GDP) is taken on the Y-axis.
Business Cycle Phases
There are four phases or stages of the business cycle.
Economic Growth or Expansion
This stage of the business cycle refers to an increase in the real GDP of the country over a period of time. This is also called the expansion phase of the business cycle. It is also called economic recovery if growth occurs after a recession. Any downturn in an economy will eventually lead to a recovery when real GDP starts to increase again. This is because corrective government action starts to take effect.
Economic growth is a virtuous cycle in which an increase in the income level leads to a rise in the demand for products, which leads to a rise in the production level and hence a rise in employment levels.
Economic Boom or Peak
This stage of the business cycle refers to a time period when the real GDP is at its maximum. This stages shows the peak of the business cycle. This is a time when the economy is producing output (actual GDP) close to its potential GDP. Incomes and profits are high. Inflation is also high because of the higher demand for goods and services. Wages are also high because of the shortage of skilled workers. Because of the high inflation, goods and services become uncompetitive in foreign markets. As a result, businesses start to lose confidence because their profits are hurt by the higher costs. To try and bring down inflation, interest rates are usually increased. This often leads to a downturn in the economy.
Economic Recession or Contraction
This stage of the business cycle refers to a decrease in the real GDP of the country over a period of time. This is also called contraction. Incomes and consumer demand fall, and profits are reduced. A decrease in aggregate demand and higher interest rates start to take effect. Real GDP starts to fall. If real GDP continues to fall for at least two consecutive quarters, this is technically called a recession. Some firms make losses, and others fail completely.
A recession is a vicious cycle in which a decrease in income level leads to a fall in demand for products, which leads to a fall in production level and hence an increase in the cyclical unemployment.
Economics Slump or Trough
This stage of the business cycle refers to a time period when the real GDP is at its lowest point. This is a time when the economy has a high level of unemployed resources. There is a significant decline in the incomes and profits. It is a very serious and prolonged recession and is also called depression. These deep recessions can prolong if the government fails to take corrective action.
Summary of the Features of Business Cycle Phases
A summary of the main features of each stage of the business cycle is given below.
|
Feature |
Growth |
Boom |
Recession |
Slump |
|
Real GDP |
Increasing |
Maximum |
Decreasing |
Minimum |
|
Income / Profit |
Increasing |
High |
Decreasing |
Low |
|
Consumption |
Increasing |
High |
Decreasing |
Low |
|
Investment |
Increasing |
High |
Decreasing |
Low |
|
Wages |
Increasing |
High |
Decreasing |
Low |
|
Unemployment |
Decreasing |
Low |
Increasing |
High |
|
Tax Revenue |
Increasing |
High |
Decreasing |
Low |
|
Prices of Capital Goods |
Increasing |
High |
Decreasing |
Low |
|
Demand for Normal Goods |
Increasing |
High |
Decreasing |
Low |
|
Demand for Inferior Goods |
Decreasing |
Low |
Increasing |
High |
Significance of Business Cycle for Firms
The concept of business cycle is very useful for firms in different industries in order to make good business decisions. Here are a few examples:
Firms Producing Luxury Goods
During economic growth, the firms producing luxury goods (e.g. cars) will see an increase in the demand for their products. They can increase the prices of these consumer goods to increase profit margins. They can also increase business investment into capital goods, or increase the range of products or production in order to get benefit of higher demand for their products.
During economic recession, the firms producing luxury goods will see a decrease in the demand for their products. During that time, they can offer credit terms to improve the affordability of their products. They can also use sales promotions. They can also low-priced products in their portfolio.
Firms Producing Inferior Goods
During economic growth, the firms producing inferior goods (e.g. low-priced clothing) will see a decrease in the demand for their products. During that time, they can widen the product range by adding some upmarket products.
During economic recession, the firms producing inferior goods will see an increase in the demand for their products. During that time, they can increase promotion to get benefit of the higher demand. They can also increase their production and distribution outlets.
Significance of Business Cycle for Government
Business cycle is a vital tool for governments to design their macroeconomic policies effectively.
Here are some examples:
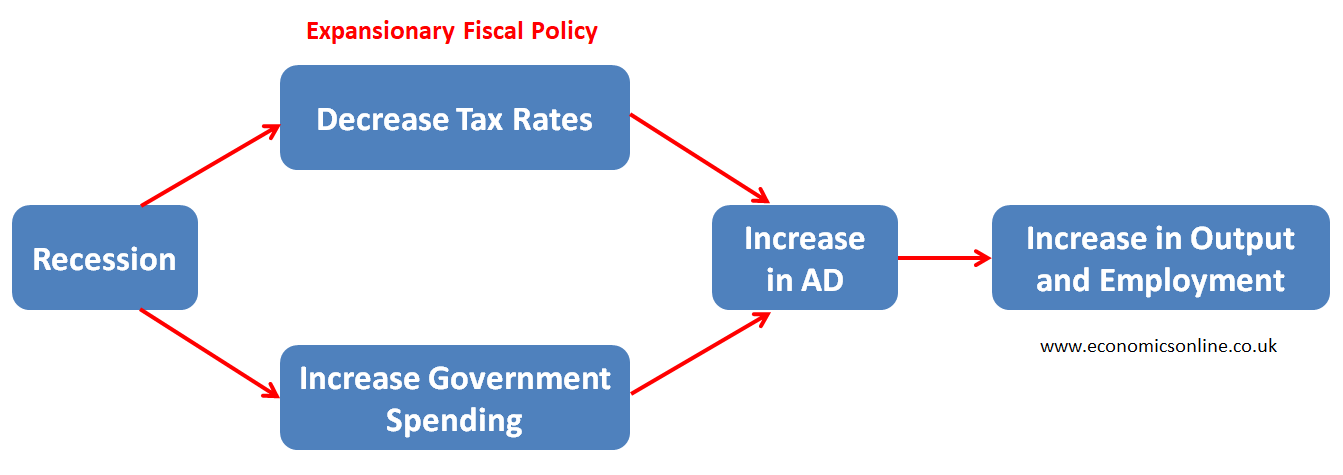
During Economic Recession
During economic recession, the output of the country is decreasing due to lower aggregate demand and the unemployment is increasing.
Governments can use an expansionary fiscal policy (a decrease in taxes and an increase in government spending) or an expansionary monetary policy (a decrease in interest rate and an increase in money supply) to get rid of that recession.
These policies can increase aggregate demand to promote economic growth and reduce unemployment.
The working of an expansionary fiscal policy is shown in the diagram below.
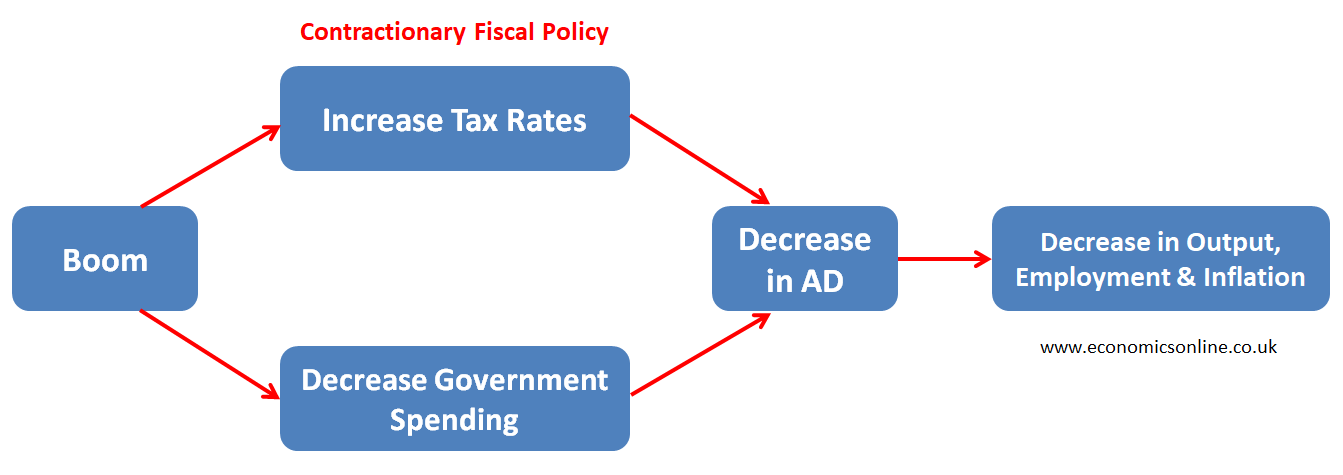
During Economic Boom
During economic boom, an economy is likely to face the peak of economic activity with high rate of inflation which can also have a negative effect on its balance of payments.
Governments can use a contractionary fiscal policy (an increase in taxes and a decrease in government spending) or a contractionary monetary policy (an increase in interest rate and a decrease in money supply) to get rid of the economic boom.
These policies can decrease aggregate demand to control inflation.
The working of a contractionary fiscal policy is shown in the diagram below.
Business Cycle and the Great Depression
The great depression, which spanned from 1929 to the late 1930s, is considered as a classic example of the recession phase of business cycle. The Great Depression had a widespread impact on countries worldwide, with major economies such as the United States, Canada, Germany, and the United Kingdom being particularly affected. During this time, firms suffered huge losses. There was high unemployment and scarcity of jobs. Shops and businesses were closed down, leading to empty streets. There was uncertainty and fear among the population. The great recession is remembered as a dark and challenging period in history.
Conclusion
The business cycle graph is a valuable tool for understanding the patterns and fluctuations in economic activity. By studying its phases, producers and governments can make better decisions and policies according to the prevailing stage of the business cycle.