
An image of cans of Pepsi and Coca Cola in shelves.
Kinked Demand Curve
Kinked Demand Curve Definition
A kinked demand curve refers to a unique demand curve with a bend in it, which explains price rigidity in the non-collusive model of oligopoly. This demand curve is not a straight line and has different values of price elasticity of demand above and below the kink (bend). The kinked demand curve explains price rigidity and the interdependent behaviour of firms under non-collusive models of oligopoly.
Assumptions of the Kinked Demand Curve
The following are the assumptions of kinked demand curve.
- The market price or equilibrium price is at kink, which is already given. There is always an initial price in the market, but kinked demand curve theory gives no explanation of why this price was set.
- There is oligopoly in the market, with a few dominant firms.
- Firms do not cooperate or collude due to their high tendency to compete.
- The decisions of one firm affect the decisions of the other firms (Interdependence).
- Kinked demand curve is defined for an individual firm.
Explanation with Graph
The following graph illustrates the kinked demand curve.
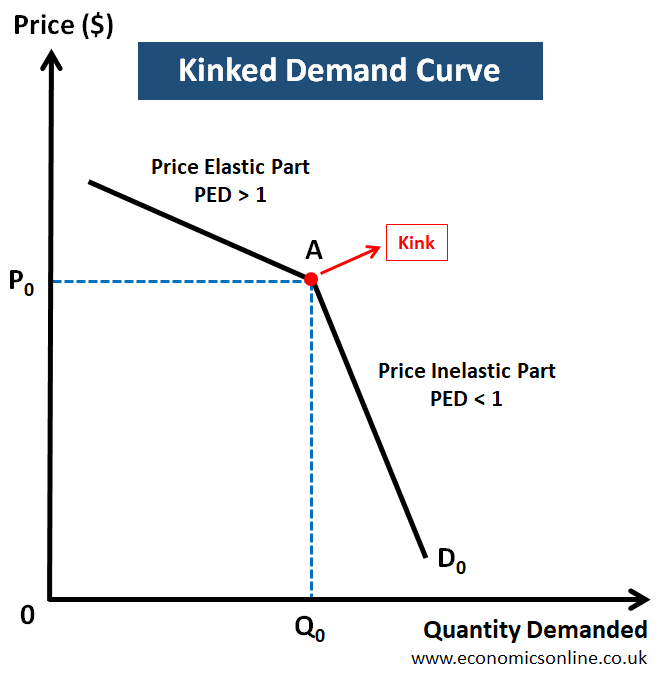
The above graph illustrates the kinked demand curve D0. The quantity demanded is taken on the horizontal axis (x-axis) and the price on the vertical axis (y-axis). The kink is a bend in the demand curve, which is shown by point A. The importance of this kink is that it determines the equilibrium price and quantity. Here, the equilibrium price is P0, while the equilibrium quantity is Q0. There are two parts of the kinked demand curve and both have different values of price elasticity of demand (PED). The upper portion of this demand curve (above the kink) is price elastic part with PED>1, while the lower portion (below the kink) is price inelastic part with PED<1.
Understanding Kinked Demand Curve with an Example
Let’s take an example of duopoly (an oligopoly market with two dominant firms), where the firms are Pepsi and Coca Cola. Both firms are charging the same price, which is determined by the kink. Both firms are facing kinked demand curves and sticky prices. Now let’s explain kinked demand curve for Pepsi. The kinked demand curve faced by Pepsi has the following two parts:
The Price Elastic Part of the Kinked Demand Curve
The upper part of the kinked demand curve above the kink is price elastic, as shown in the diagram below.
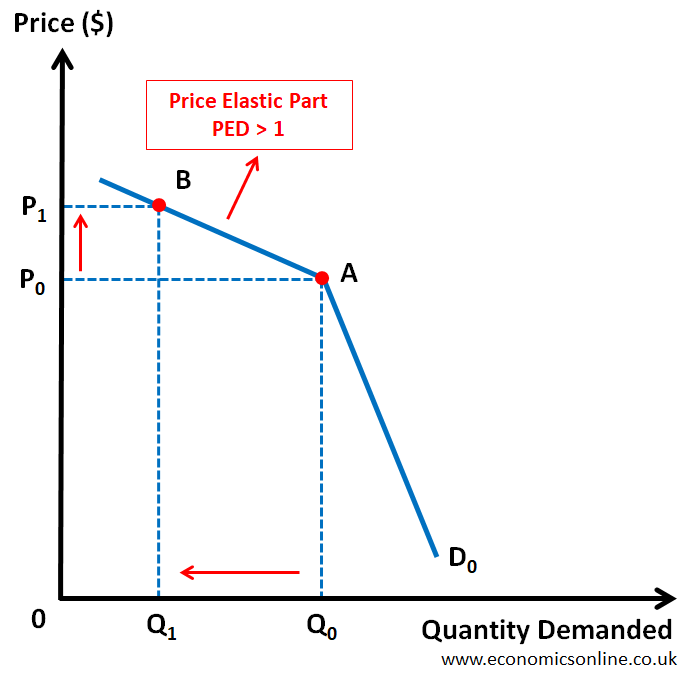
In the above graph, the upper portion of the kinked demand curve faced by Pepsi is shown. When Pepsi increases its price from P0 to P1, it faces price elastic demand, which means that the quantity demanded will decrease by a large percentage, leading to a fall in total revenue. When Pepsi increases its price, then it becomes more expensive for consumers, and Coca Cola will take advantage of this price increase. Consumers will tend to shift towards Coca Cola because its price is the same and more affordable for customers. Pepsi will face a fall in its revenue because the percentage decrease in quantity demanded of Pepsi is greater than the percentage increase in its price. Here are the details:
Total revenue at point A (before the price increase) = Area OP0AQ0
Total revenue at point B (after the price increase) = Area OP1BQ1
Since area OP1BQ1 is smaller than area OP0AQ0, it means that the revenue of Pepsi is decreased due to an increase in price. This means that the decision to increase the price is harmful for Pepsi and beneficial for its competitor, Coca-Cola. Hence, Pepsi cannot increase its price.
The Price Inelastic Part of the Kinked Demand Curve
The lower part of the kinked demand curve below the kink is price inelastic, as shown in the diagram below.
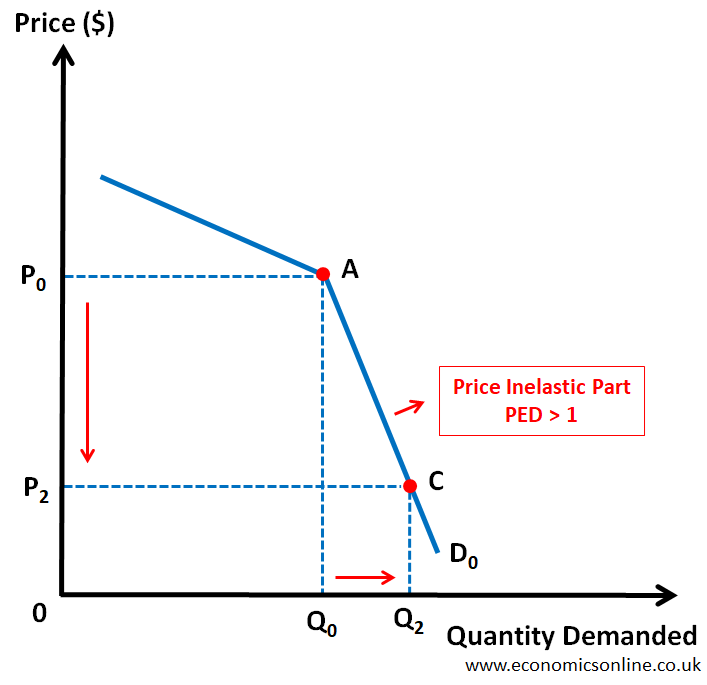
In the above graph, the lower portion of the kinked demand curve faced by Pepsi is shown. When Pepsi decreases its price from P0 to P2, it faces price inelastic demand, which means that the quantity demanded will increase by a small percentage, leading to a fall in total revenue. When Pepsi decreases its price, then it becomes more affordable for consumers, but Coca Cola will immediately respond by decreasing its price as well and there will be a small percentage increase in the demand for Pepsi. Both Pepsi and Coke will face a fall in revenue due to fewer profit margins on each bottle sold. Pepsi will face a fall in its revenue because the percentage increase in quantity demanded of Pepsi is less than the percentage decrease in its price. Here are the details:
Total revenue at point A (before the price decrease) = Area OP0AQ0
Total revenue at point C (after the price decrease) = Area OP2BQ2
Since area OP2BQ2 is smaller than area OP0AQ0, it means that the revenue of Pepsi is decreased due to a decrease in price. This means that the decision to decrease price is harmful for Pepsi as well as its competitor, Coca Cola. Hence, Pepsi cannot decrease its price.
Prices Stability
The above two graphs illustrate the price stability or rigidity in oligopolistic market of Pepsi and Coke. In the case of a true kinked demand curve, both firm have no incentive to either increase or decrease prices. Hence, the price remains stable. Firms facing kinked demand curves do not indulge in price war, rather, they focus on non-price competition.
Kinked Demand Curve in Gasoline Market
Another example of a kinked demand curve is for gasoline, as this product is homogeneous because it has a few dominant sellers making the market structure oligopolistic. If a petrol station increases its price, then there will be a fall in its revenue as customers will switch to other petrol stations. But if one petrol station reduces prices, then other petrol stations have to follow suit and reduce their product prices. This reduction in prices will be self-destructive for the first firm and its revenue will fall. Hence, the only option is to keep the price the same at the kink.
The Work of Paul Sweezy
Paul Marlor Sweezy was famous as a Marxist economist, a publisher, a political activist, and the founder and editor of a magazine, Monthly Review. He was famous because of his contribution to economic theories, especially his work on applying Marxist analysis to financialisation, stagnation, and monopolisation in capitalism.
Paul Marlor Sweezy was the one who introduced the concept of the kinked demand curve in determining oligopoly pricing in his 1942 book, “The Theory of Capitalist Development.”
Conditions for Kinked Demand Curve
The following are some conditions for the kinked demand curve. These are also the conditions of oligopoly in non-collusive models.
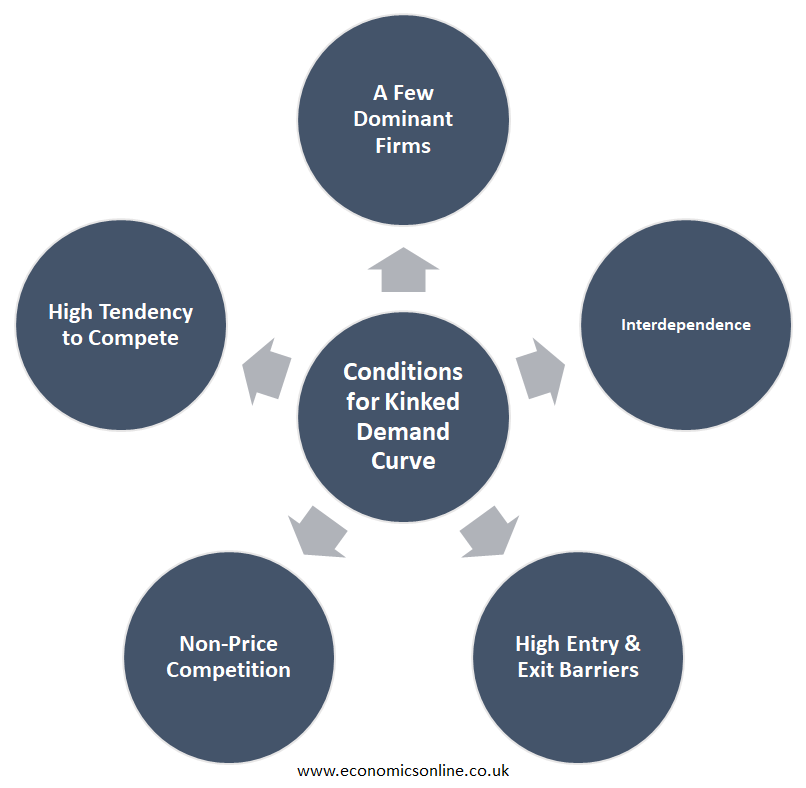
A Few Dominant Firms
One condition of the kinked demand curve is that there should be a few dominant firms in the market. These few firms have a high concentration ratio equal to or greater than 50% of the market.
Interdependence
Firms are interdependent and interconnected as they are affected by each other’s decisions. So, firms make decisions based on their competitors decisions, as competitors’ decision affect their position in the market directly.
High Entry and Exit Barriers
There are high barriers to entry such as huge sunk costs, economies of scale, immense start-up costs, and high marketing expense. Exit barriers are also high. It is very difficult for new firms to enter the market.
Non-Price Competition
Firms focus on non-price competition, such as high-quality advertising and branding, to gain more market share. Firms do not prefer to compete through prices because they are rigid.
High Tendency to Compete
In collusive models of oligopoly, firms cooperate. But this does not happen in case of kinked demand curve, where firms don’t cooperate due to a high tendency to compete.
Limitations of Kinked Demand Curve
There are some limitations and reasons why the kinked demand theory of oligopoly is considered an incomplete theory of oligopoly:
- This theory does not clearly explain how initial kink is established in the market in the first place.
- This theory does not allow the possibility that the price increase by one firm in an oligopolistic market is matched by other firms in the same market. It is a practice that has been observed frequently.
- This theory does not consider the possibility that firms in an oligopolistic market can collude in setting output and prices.
- An alternative theory known as the game theory gives another explanation of the interdependence among firms in non-collusive models of oligopoly.
Conclusion
In conclusion, a kinked demand curve has two parts: one is price elastic demand curve and the other is price inelastic demand curve. This theory is used to explain the interdependent behaviour of firms. Kinked demand curve theory provides good explanations of price rigidity in oligopolies.

