
An image showing a sales transaction to earn revenue.
Total Revenue Formula
What is Revenue?
Revenue is the amount of money earned by a firm by selling goods and services in a given time period.
Types of Revenue
There are three different types of revenue.
- Total Revenue (TR)
- Marginal Revenue (MR)
- Average Revenue (AR)
Total Revenue (TR)
Defintion
Total revenue is the total amount of money earned by a firm by selling goods and services in a given time period. It is also called total sales, sales revenue or gross revenue of a firm.
Total Revenue Formula
The formula for calculating total revenue is given below.
Total Revenue = Price x Quantity Sold
TR = P x Q
Here ‘P’ stands for price and ‘Q’ stands for quantity sold (the number of units sold). For a service-based business, sales price means the price per service and the quantity means the number of services.
Total Revenue Calculation Example
Suppose that the price (P) of a product is $5 and the quantity of goods sold (Q) is 500 units. In this case, total revenue calculations are shown below:
Total Revenue (TR) = Price x Quantity Sold = $5 x 500 units = $2500
Marginal Revenue (MR)
Definition
Marginal revenue is the additional revenue earned by a firm by selling an additional unit of output.
Marginal revenue is the addition in total revenue.
Marginal Revenue Formula
The formula for calculating marginal revenue is given below.
Marginal Revenue Calculation Example
Consider the following data.
Q1 = 5 units Q2 = 6 units TR1 = $500 TR2 = $560 MR6 =?
The marginal revenue (MR) of the 6th unit is calculated as follows:
(MR)6 = Change in TR/Change in Q = (TR2 – TR1) / (Q2 – Q1) = ($560 - $500) / (6 – 5) = $60
It means $60 revenue is added because of the sale of the sixth unit.
Average Revenue (AR)
Definition
Total revenue divided by the quantity sold is called average revenue.
Average Revenue Formula
The formula for calculating average revenue is given below.
Average Revenue Calculation Example
Suppose that the total revenue (TR) of $500 is generated by selling the total number of units of 5. In this case, the average revenue is calculated as follows:
Average Revenue (AR) = Total Revenue / Quantity = $500 / 5 = $100
It is important to note that the average revenue is also called the average price (AR=P).
Revenue Graphs for Perfect Competition
In a perfectly competitive market, firms are price-takers, and price (P) is constant. Suppose that P = $5.
Now, consider the following data table showing the values of TR, MR, and AR for the quantity changing from 0 to 5 units.
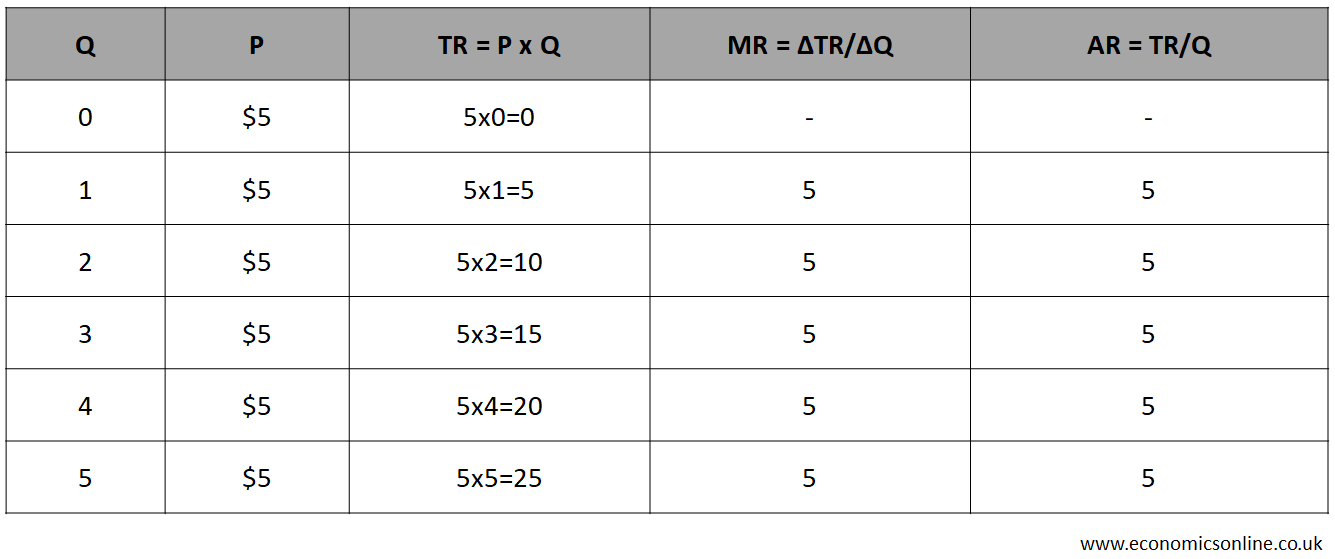
From the above data table, we can make the graphs of revenue curves as shown in the diagram below.
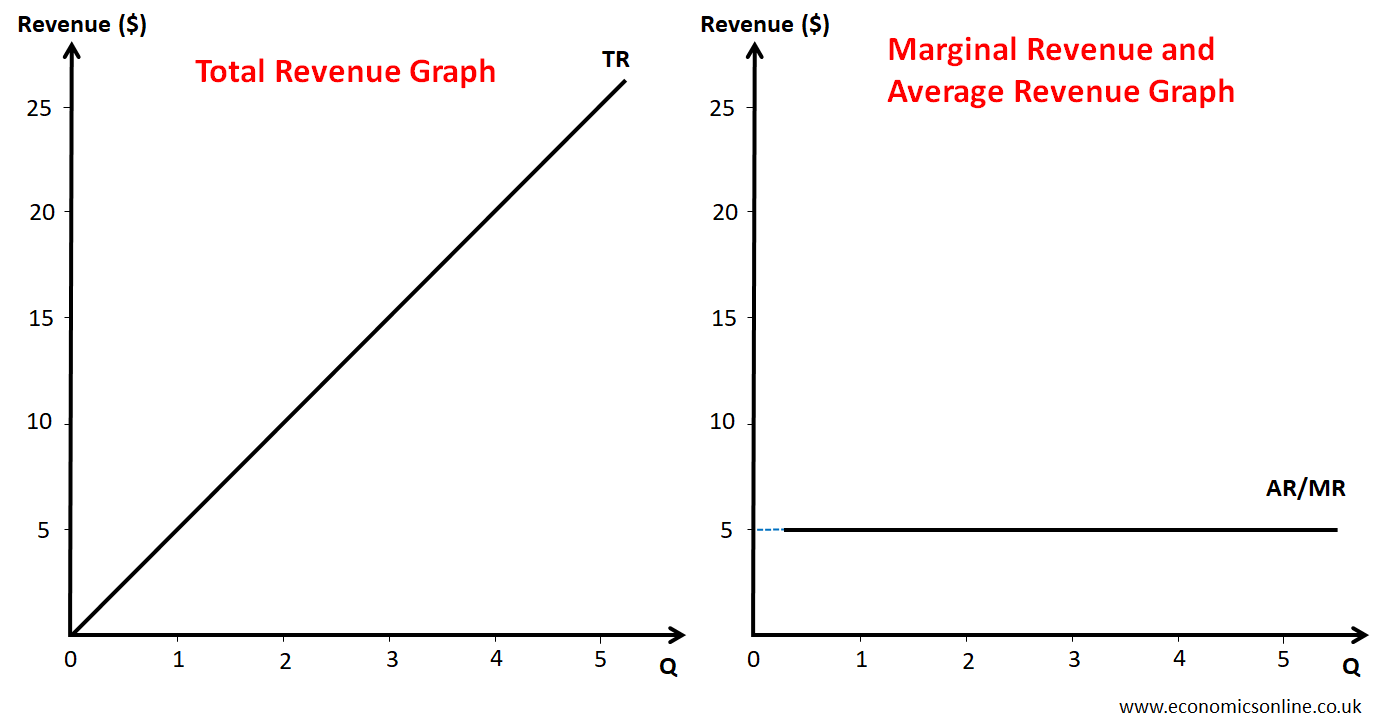
In the above diagram, the total revenue graph is an upward sloping straight line, while the graph of average revenue and marginal revenue is a horizontal straight line parallel to the X-axis.
Revenue Curves for Imperfect Competition
Here, we will discuss the general shapes of revenue curves in imperfect competition (monopoly and monopolistic competition).
In imperfect competition, firms are price makers, but customers buy more quantities of goods at a lower price, according to the law of demand.
Now, let’s consider the following data table showing the values of TR, MR, and AR for the quantity changing from 0 to 11 units.
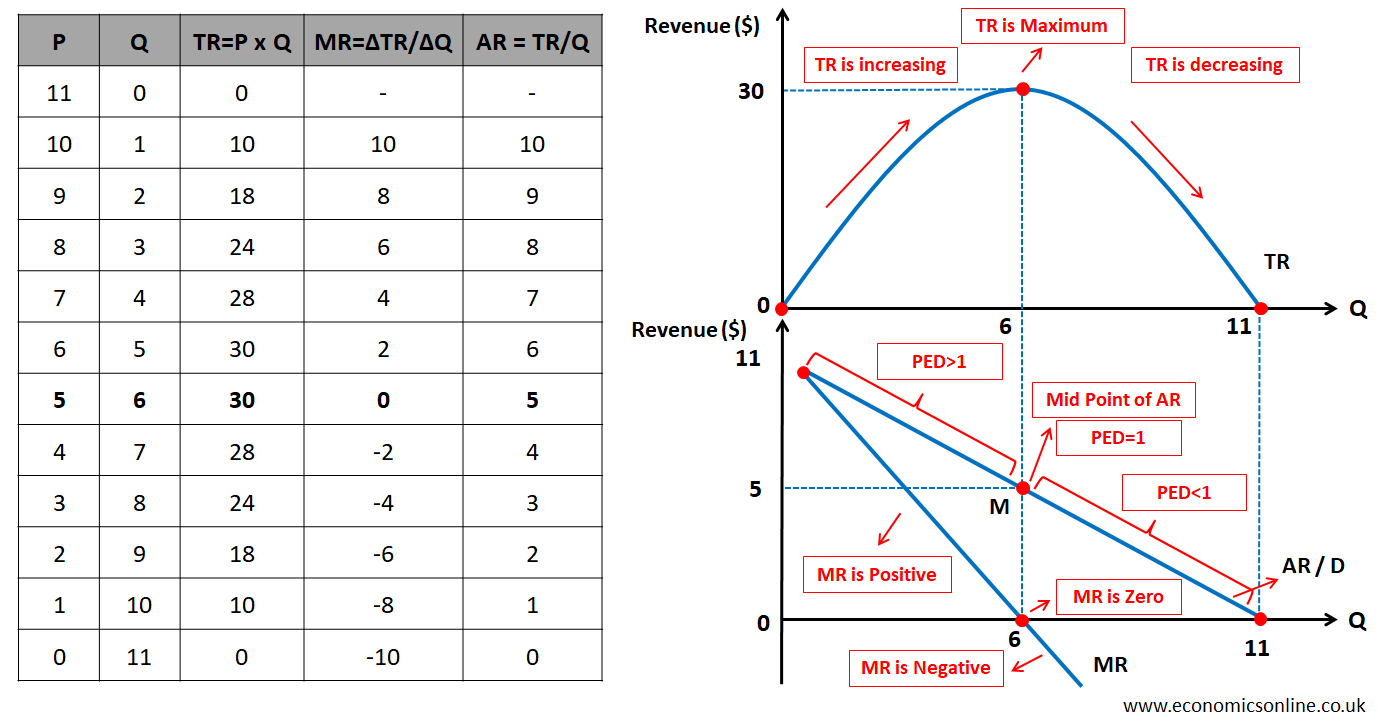
From this data table, we can make the graphs of revenue curves as shown in the diagram above.
In the above diagram, the total revenue graph is an upward sloping straight line, while the graph of average revenue and marginal revenue is a horizontal straight line parallel to the X-axis.
In the above graphs, the total revenue (TR) initially increases, reaches a maximum value, and then decreases. Average revenue (AR) is downward sloping because of the decrease in price. Remember that average revenue is always equal to the price (AR=P). The total revenue is maximum at the midpoint ‘M’ of the average revenue curve.
The marginal revenue curve is also downward sloping. The marginal revenue curve is drawn below the average revenue curve because MR < AR. The rate of decrease of MR is double as compared to rate of decrease of AR, as shown by the data table. That is why marginal revenue is zero at the midpoint of average revenue.
Price Elasticity of Demand and Total Revenue
The degree of responsiveness of the quantity demanded of a good to the price change alone is called the price elasticity of demand (PED). PED determined the direction of change in total revenue when price is chnaged. Please note that the average revenue curve is also the demand curve.
Before the mid-point of the AR curve, demand is price elastic (PED>1) and total revenue increases with the decrease in price.
At the mid-point ‘M’ of the AR curve, demand is price unit elastic (PED=1) and total revenue becomes constant at its maximum value.
After the mid-point of the AR curve, demand is price inelastic (PED<1) and the total revenue decreases with the decrease in price.
The knowledge of PED can help a business make decisions about the change in price in order ot increase total revenue. Higher prices (price increases) can increase total revenue when demand is price inelastic.
Importance of Total Revenue
Total Revenue and Profit
Profit is the positive difference between total revenue and total cost or total expenses.
Profit = Total Revenue – Total Cost
Firms use the value of total revenue in order to calculate total profit for any accounting period. Total profit cannot be calculated without calculating total revenue. Total revenue is also used in calculating other important figures of gross profit, operating profit and net profit. Gross profit is calculated by subtracting the cost of goods sold (COGS) from total revneue in income statement. Net profit is calculated by subtrating operating expenses from gross profit.
Financial Performance
Total revenue is an important metric in assessing the financial performance of a business. Total revenue is also used in calculating ratios and a firm’s market share. Total revenue maximisation is an important objective that some firms try to achieve. An increase in total revenue is an indicator of business growth. By tracking the total revenue figure over time, firms can assess their sales performance, identify trends, and make decisions about pricing and production.
Factors Affecting Total Revenue
Many factors affect total revenue beyond price and the quantity sold. These include changes in consumer preferences, competition, advertising, the pricing strategies of competitors, and overall market conditions.
Conclusion
Total revenue is a basic concept in economics that means the amount of money earned by a firm from the sales of goods and services. It is an important figure in assessing business performance and calculating profits. By understanding the total revenue formula and its implications, firms can make better decisions regarding pricing and production.