
An image showing a clock and the growth in income.
What is Short Run Aggregate Supply (SRAS)?
Aggregate Supply (AS)
The total output (real GDP) that producers in an economy are willing and able to supply at a given price level in a given time period is called Aggregate Supply (AS).
There are two types of aggregate supply.
- Short Run Aggregate Supply (SRAS)
- Long Run Aggregate Supply (LRAS)
In this article, we will look into the short run aggregate supply in detail.
Short Run Aggregate Supply (SRAS) Definition
Short Run Aggregate Supply (SRAS) refers to the total amount of goods and services that all firms within an economy are willing and able to produce at different price levels in the short run, assuming other factors remain constant. It represents the productive capacity of an economy in the short run, usually within a year or less.
Short Run Aggregate Supply (SRAS) Curve
The short-run aggregate supply curve depicts the positive relationship between the price level and the real GDP when there has not been enough time for input prices to adjust to the fluctuations in aggregate demand.
Short Run Aggregate Supply (SRAS) Graph
The graph of the SRAS curve is given below.
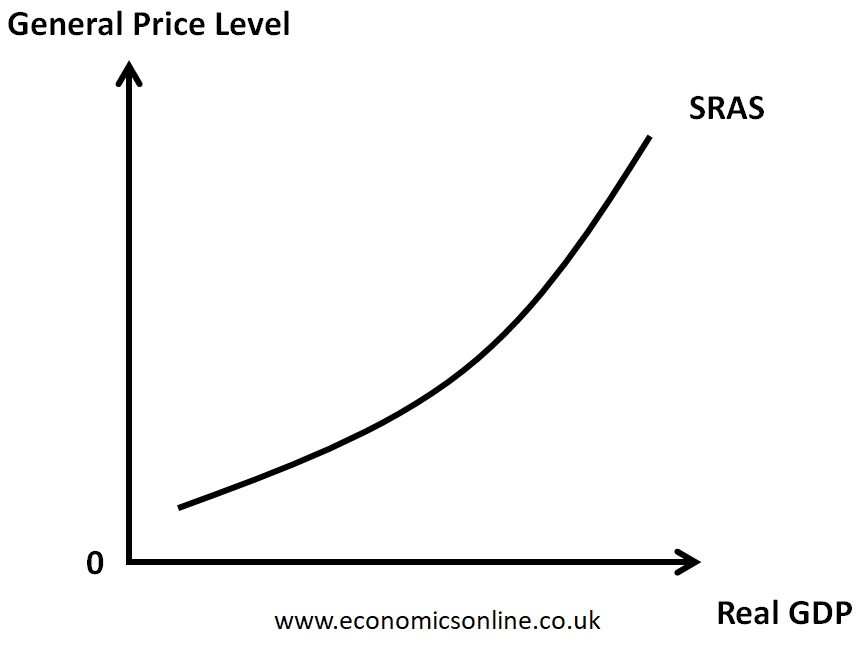
In the above graph, real GDP is taken on the horizontal axis (X-axis) and the general price level is taken on the vertical axis (Y-axis). The SRAS curve is an upward-sloping curve that shows the positive or direct relationship between the real GDP of the country and the general price level.
Why is the SRAS Curve Upward Sloping?
The SRAS curve is upward sloping due to the following three reasons.
The Profit Effect
When the general price level is increased (higher inflation), firms can sell their products at higher prices without much increase in their costs. This will increase the profit of firms, and hence, they will increase their output as a result of an increase in the general price level.
The Cost Effect
Even though some input costs, such as raw material costs and the prices of other factors of production, remain unchanged in the short run, the average cost may still rise with an increase in the general price level. This might be due to overtime payments or an increase in energy prices, for instance. To cover this higher cost, firms have to produce a higher output.
The Misinterpretation Effect
When the general price level increases, producers may misinterpret that their products are becoming popular. As a result, they produce more output at a higher price level.
Determinants of SRAS
There are many factors affecting the short run aggregate supply. Some of these factors and their effect on the SRAS curve are summarised in the table below.
|
No. |
Determinants |
Change in the Determinant |
Effect on SRAS |
|
1 |
Cost of Fuel |
Increase |
Decrease |
|
Decrease |
Increase |
||
|
2 |
Corporation Tax |
Increase |
Decrease |
|
Decrease |
Increase |
||
|
3 |
Subsidy |
Increase |
Increase |
|
Decrease |
Decrease |
||
|
4 |
Climate |
Favourable |
Increase |
|
Unfavourable |
Decrease |
||
|
5 |
Natural
Resources |
Discovery |
Increase |
|
Exhaustion |
Decrease |
||
|
6 |
Labor Force |
Increase |
Increase |
|
Decrease |
Decrease |
||
|
7 |
Labour
Productivity |
Increase |
Increase |
|
Decrease |
Decrease |
||
|
8 |
Women Participation |
Increase |
Increase |
|
Decrease |
Decrease |
||
|
9 |
Exchange Rate |
Depreciation |
Increase |
|
Appreciation |
Decrease |
Changes in SRAS
There are two types of changes in the SRAS curve.
- Movement along the same SRAS Curve
- The Shift of the SRAS Curve
Movement along the same SRAS Curve
Movement along the same SRAS curve is caused by a change in the general price level. It can be an extension or a contraction in the SRAS.
Extension in SRAS
An increase in the real GDP of a country due to an increase in the general price level is called an extension in SRAS.
It is illustrated by the following diagram:
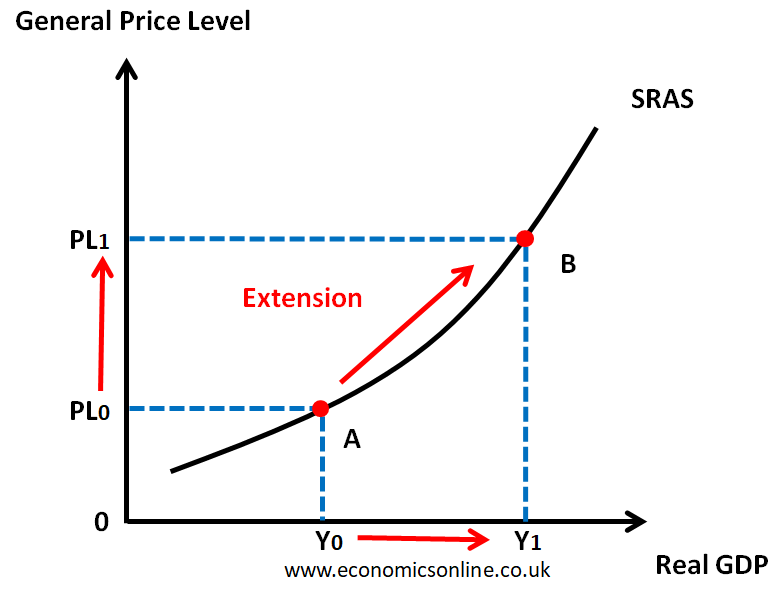
The movement from point A to point B is an extension in SRAS.
Contraction in SRAS
A decrease in the real GDP of a country due to a decrease in the general price level is called a contraction in SRAS.
It is illustrated by the following diagram:
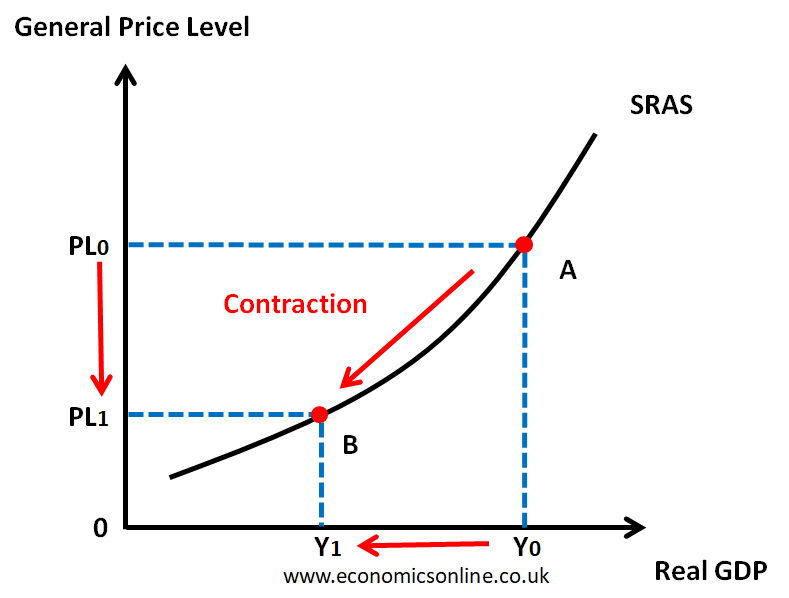
The movement from point A to point B is a contraction in SRAS.
Shift of the SRAS Curve
A shift in the SRAS curve is caused by a change in any determinant of SRAS. It can be a rise or a fall in SRAS.
Rise in SRAS
The rightward shift of the SRAS curve is called the rise in SRAS. It occurs when the real GDP is increased due to a change in any determinant of SRAS.
The following diagram illustrates the rise in SRAS.
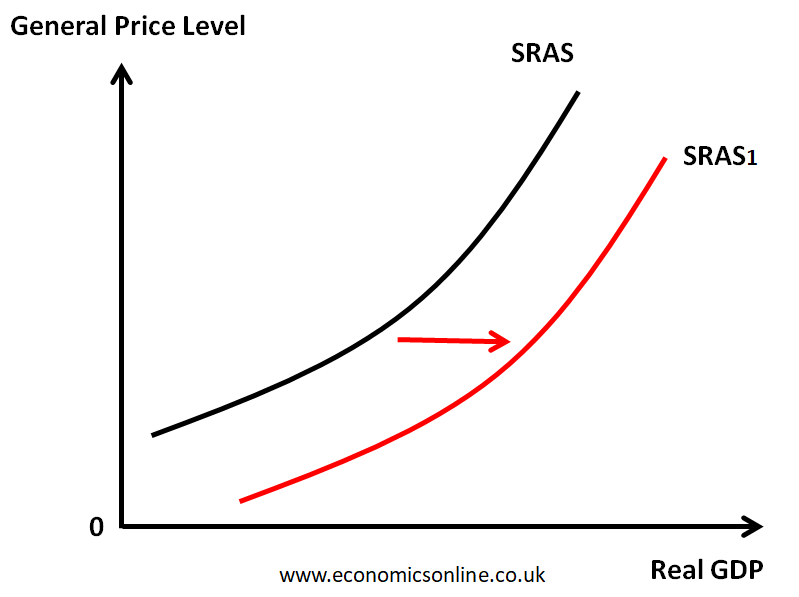
The rise in the SRAS curve is from SRAS0 to SRAS1.
Fall in SRAS
The leftward shift of the SRAS curve is called the fall in SRAS. It occurs when the real GDP decreases due to a change in any determinant of SRAS.
The following diagram illustrates the fall in SRAS.
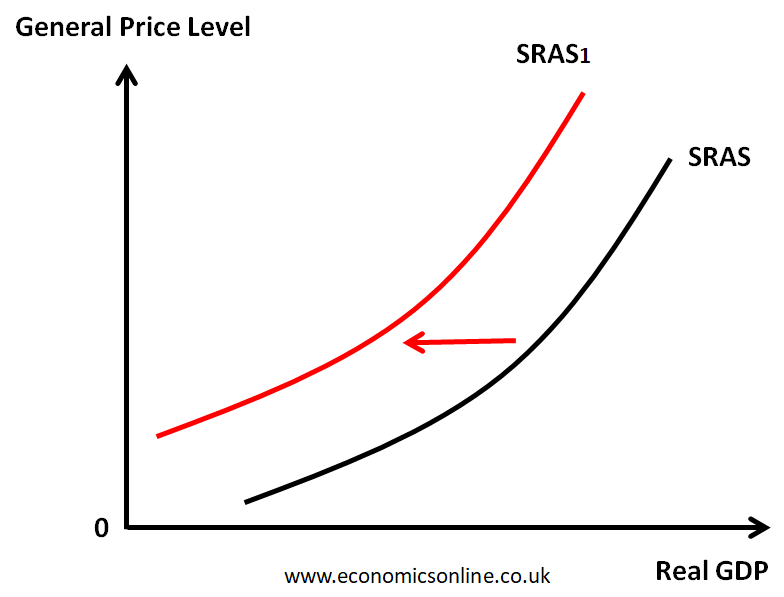
The fall in the SRAS curve is from SRAS0 to SRAS1.
SRAS vs. LRAS
The long-run aggregate supply (LRAS) refers to the total amount of goods and services that all firms within an economy are willing and able to produce at different price levels in the long run.
The SRAS curve illustrates the relationship between the general price level and the real GDP in the short run when the prices of inputs do not change. On the other hand, the long-run aggregate supply curve depicts the relationship between the general price level and the real GDP when the prices of inputs have time to adjust to the fluctuations in aggregate demand.
Usefulness of the SRAS Curve
Understanding SRAS is important in aggregate demand and aggregate supply analysis (AD-AS analysis) for comprehending the overall state of the economy. Both aggregate demand and aggregate supply curves are used to determine the macroeconomic equilibrium in an economy. This is also helpful in analysing the impact of economic conditions on the key macroeconomic objectives of economic growth, unemployment, and inflation. Here are a few key implications:
Economic Growth and Employment
An extension in SRAS due to a rise in the aggregate demand curve, indicates an increase in the productive capacity of the economy, enabling higher output levels. This growth can lead to higher employment rates and an improved standard of living.
Inflation
In the short run, a rise in SRAS can help alleviate inflationary pressures by expanding output, when the general price level. decreases This is important when using supply-side policies. On the other hand, a fall in the SRAS curve can cause cost push inflation.
Conclusion
Short Run Aggregate Supply (SRAS) is the total output that firms are willing and able to produce in an economy in the short run. By considering the determinants of SRAS, one can analyse how changes in SRAS impact economic growth, inflation, and the unemployment rate in an economy. Policymakers can leverage the knowledge of SRAS to design effective policies to control inflation and promote economic growth and employment in the economy.


