
An image of a map with currency units.
Understanding the J Curve with Graphs
J Curve Definition
The J curve refers to a curve that illustrates the short-run and long-run effects of the depreciation of a country’s currency on its balance of trade.
Graphically, the J curve explains the change in the balance of trade (BOT) of a country over a period of time following the depreciation of its currency.
J Curve Effect
The J curve effect refers to the effect of exchange rate depreciation on the balance of trade. Following the currency depreciation, the balance of trade (net exports) deteriorates in the short run but improves in the long run.
J Curve Graph
The following graph illustrates the J curve.
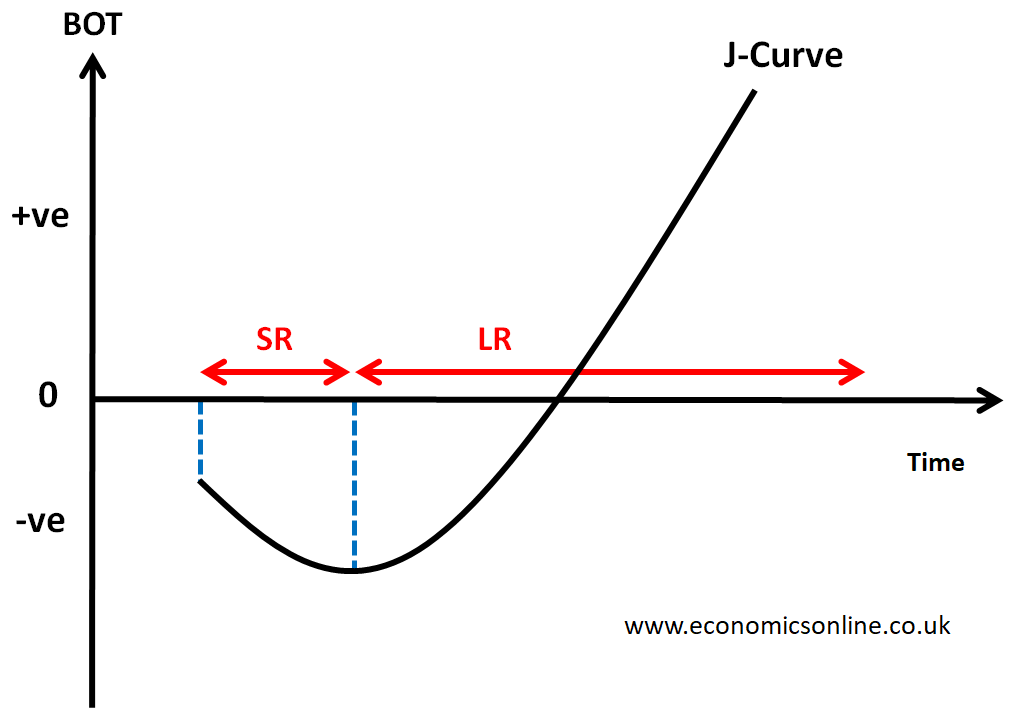
In the above graph, time is taken on the horizontal axis (x-axis), while balance of trade (BOT) is taken on the vertical axis (y-axis). This graph shows the shape of the J curve, which is similar to the English alphabet "J." That’s why this curve is named the J-curve. The first part of the J curve is downward sloping, which shows that the balance of trade is deteriorating in the short run following the depreciation of currency. The second part of the J curve is upward sloping, which shows that the balance of trade is improving in the long run following the depreciation of currency.
Explanation
The balance of trade is the difference between the value of exports and the value of imports.
Balance of Trade = Exports – Imports
BOT = X – M
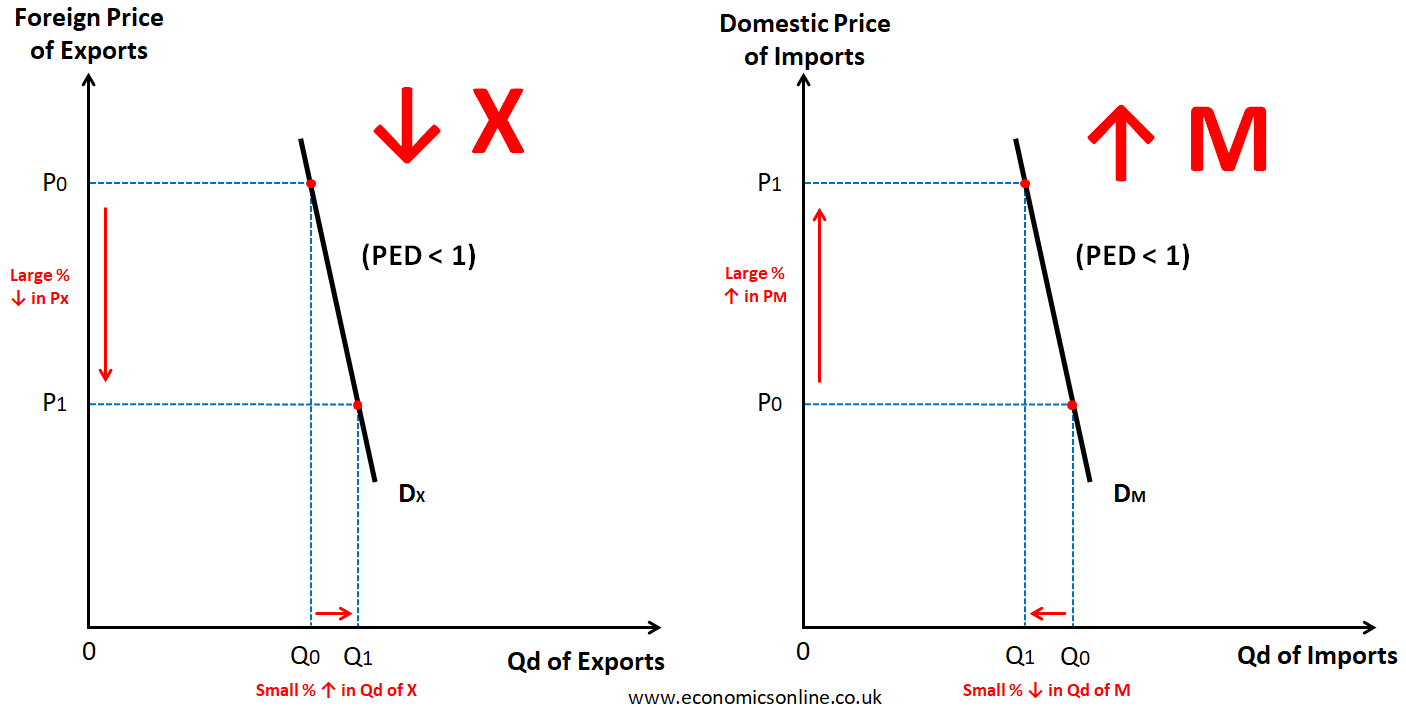
In the short run, the demand for exports and imports is price-inelastic. When the exchange rate depreciates, exports become cheaper and imports become more expensive. Due to price inelastic demand, export revenue decreases and import expenses increase, which leads to a worsening of the balance of trade.
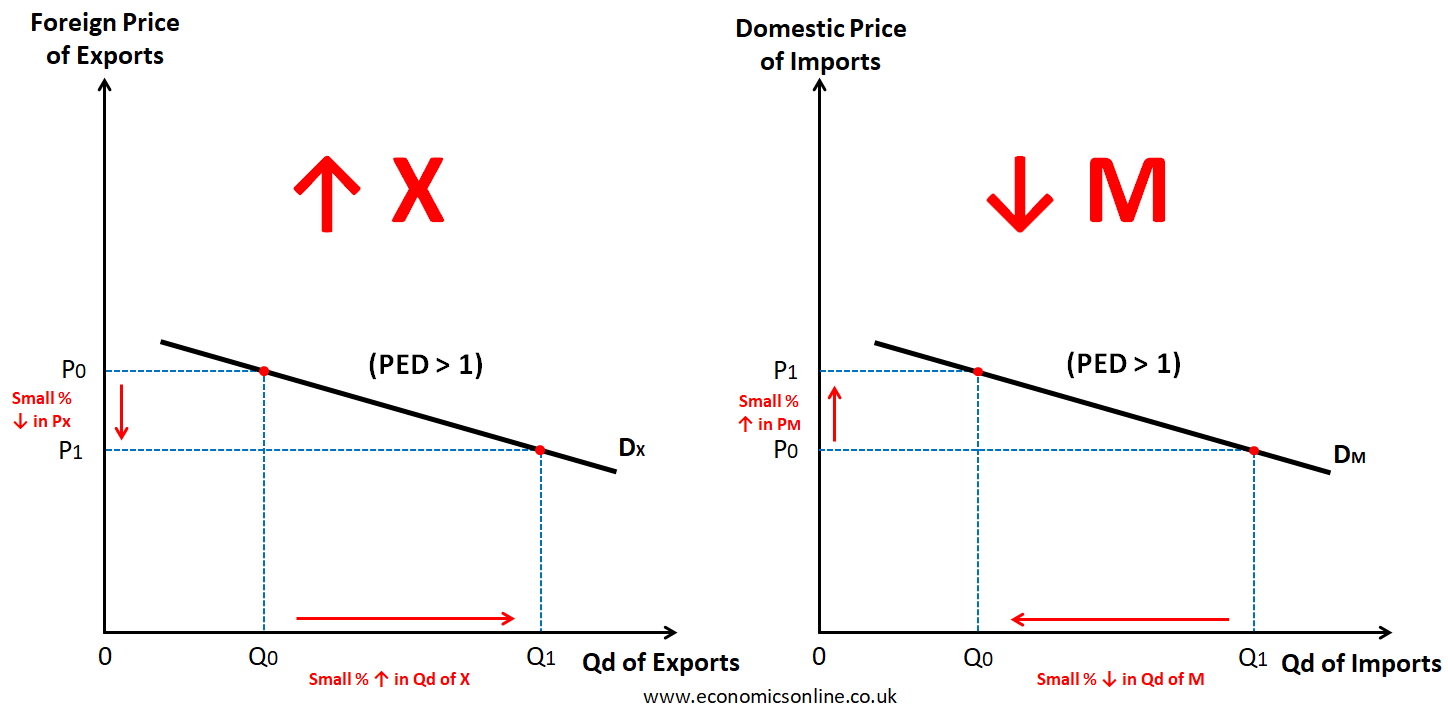
In the long run, the demand for exports and imports is price-elastic. Following the depreciation of currency due to price inelastic demand, export revenue increases and import spending decreases, which leads to an improvement in the balance of trade.
The short-run and long-run effects of depreciation are shown together in the J curve.
J Curve and the Marshal Lerner Condition
The concept of the J curve is linked with the Marshal Lerner condition, which states that the long-run effects of depreciation in the form of an improvement in the balance of trade (an increase in trade surplus or a decrease in trade deficit) can be observed only when the sum of the price elasticity of demand for exports and imports is greater than 1.
In other words, the depreciation of currency will have a long-run effect when PED of X + PED of M > 1.
The Effects of J-Curve
The following are some effects of the J curve:
Short Run Trade Deterioration
In the short run, when depreciation in a country’s currency occurs, this will increase the prices of imports, leading to an increase in import spending due to price inelastic demand. The exports become cheaper, and the value of the exports decreases due to price inelastic demand. As a result, the balance of trade decreases in the short run. The short-run effect of depreciation on exports and imports is illustrated by the following graphs:
Long Run Trade Improvement
In the long run, when depreciation in a country’s currency occurs, this will increase the prices of imports, leading to a decrease in import spending due to price elastic demand. The exports become cheaper, and the value of the exports increases due to price elastic demand. As a result, the balance of trade increases in the long run.
The long-run effect of depreciation on exports and imports is illustrated by the following graphs:
Adjustments in Trade Flows
The J curve reflects the adjustments and re-balancing of trade flows that occur in response to changes in exchange rate depreciation or devaluation. It shows how trade patterns can shift over time.
Economic Impact
The movement of the J curve has implications for a country's economy. A worsening trade balance can put pressure on the current account of balance of payments, affecting factors like inflation, interest rates, and overall economic stability.
Policy Implications
Governments may use the J-curve concept to guide their policy decisions. They may consider the short-term trade deterioration and the potential long-term benefits when managing exchange rates and trade policies.
Factors affecting the J Curve
The following factors affect the J curve, which are explained as follows:
Exchange Rate
A change in the exchange rate directly affects the country’s trade balance and the shape of the J curve.
Elasticity of Demand
The responsiveness of demand for a country's exports and imports to changes in price can influence the effectiveness and timing of the J curve.
Time Lag
It takes time for the effects of currency depreciation or appreciation to fully manifest in trade flows, which can affect the shape and timing of the J curve.
Economic Structure
The structure of a country's economy, including the composition of its exports and imports, can influence how the J curve plays out.
External Factors
Global economic conditions, market conditions including competition, and geopolitical events can also impact the J curve for a particular country.
The J-Curve in Private Equity
The pattern of investment returns and cash flows over time is known as the J curve in private equity. It shows a downward dip (high outflows) followed by an upward path (high inflows) resembling the letter "J."
The following points explain the J curve in private equity:
Initial Negative Returns
In the initial years of a private equity fund, investors often experience negative returns due to management fees, investment costs, transaction costs, and the time it takes for investments to mature.
Longer-Term Performance
As investments mature and generate returns in the later years, the J curves start to rise, indicating positive returns. This typically occurs as the portfolio companies grow, exit strategies are executed, and profits are realized.
Timeframe
The J curve is a long-term phenomenon in private fund’s investments and equity purchases, with the initial negative returns typically lasting for several years before transitioning into positive returns over the whole investment period.
Risk and Reward
The J curve illustrates the trade-off between short-term negative returns and the potential for higher long-term gains of private equity investments over a fund's life. Investors in private market funds understand that patience and a longer investment horizon of fund's lifecycle can lead to substantial returns.
Other Uses of the Term J Curve
The following points explain different uses of the term J curve:
Economics
The graphical representation of the trade balance after the depreciation of exchange rate of a country is known as the J curve in economics. It shows how a depreciation of the domestic currency can initially worsen the trade balance before leading to an improvement in the long run.
Fitness and Exercise
In the fitness world, the J curve represents the progress of an individual's fitness level over time. It shows a dip in performance or motivation at the beginning of a new fitness routine or training program, followed by a gradual improvement and surpassing of previous performance levels.
Demographics
In demographics, the J curve represents the population growth pattern of a country or region. It shows a rapid increase in population over time, resembling the shape of the letter "J," often seen in developing countries experiencing high birth rates and declining mortality rates.
Technology Adoption
In the field of technology, the J curve illustrates the adoption and acceptance of new technologies by individuals or society. When there is an increase in the adoption rate of technology, this means that technology is becoming a part of our daily lives and is globally accepted by individuals in every country where it is available.
Learning and Skill Development
In education and skill development, the J curve represents the learning curve of an individual or a group. It shows a period of slow progress and initial difficulties when learning a new skill or subject, followed by a sudden improvement and accelerated learning as knowledge and experience accumulate.
J Curve in Other Fields
The J curve phenomenon in other fields of study can be explained through different points:
Political Economy
The relationship between political stability or instability and the economic performance of a country is explained by using the J curve in political economy. It illustrates how short-term economic disruptions can lead to political instability before stability is restored.
Economic Disruptions
The J curve in political economy suggests that when there is a sudden decline in economic conditions, such as a recession or financial crisis, it can create social and political unrest.
Recovery and Stability
Over time, as the economy recovers and stabilizes, the J curve shows a return to political stability. This can be achieved through policy interventions, economic reforms, or external factors.
Political Science
In political science, the J curve represents the relationship between political repression and political resistance. It illustrates how an initial increase in repression can lead to a surge in resistance movements.
Repression and Resistance
The J curve in political science suggests that as a government intensifies its repressive measures, it can inadvertently fuel a strong backlash and resistance from the population.
Threshold Point
The J curve indicates that there is a threshold point where resistance movements gain momentum and become more organized, leading to significant political changes or revolutions.
Revolution Model
A rapid and metamorphic approach to economic development is known as the revolution model. The revolution model imposes large-scale strategies and policies to manage major changes in the economy of a country. Initiatives such as industrialization, urbanization, and modernization are also included in the revolution model. The aim of the revolution model is to accomplish major growth in a short period of time.
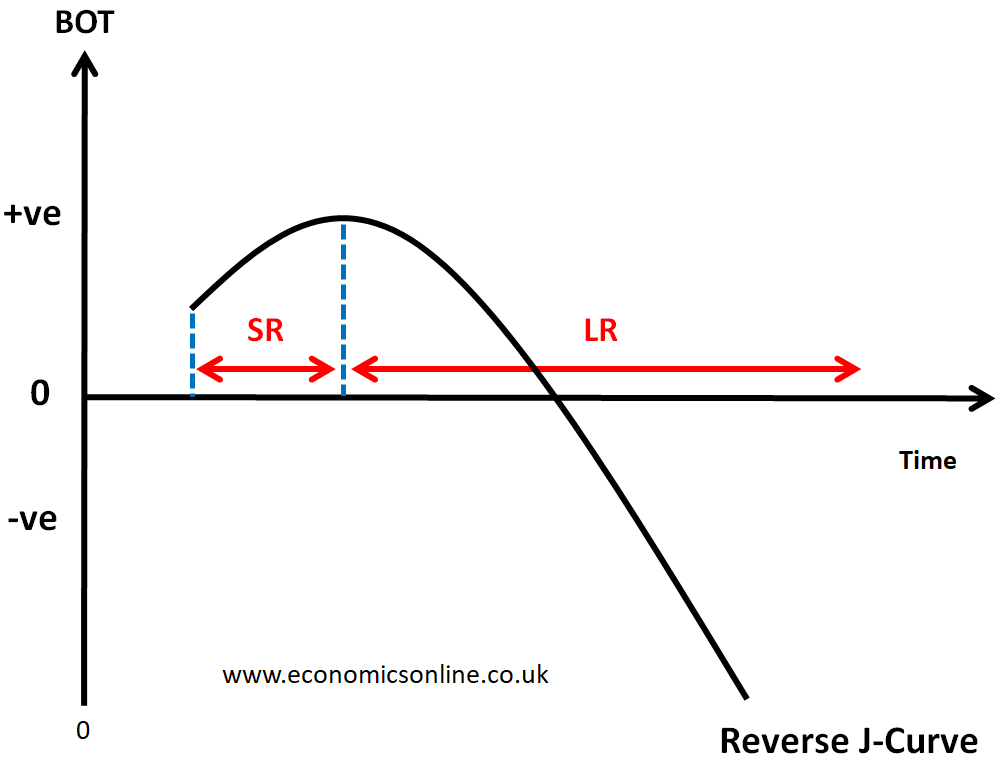
The Reverse J Curve
The reverse J curve illustrates the change in the balance of trade of a country following the appreciation of its currency. This curve suggests an initial short run improvement and a long run worsening of the balance of trade. The following graph illustrates the above points.
Conclusion
In conclusion, the J curve illustrates the effects of currency depreciation on the trade balance which worsens in the short run but improves in the long run. The J curve is a concept used to understand the dynamics of the international trade system. The concept of J curve is a useful tool, not only in economics, but also in other fields like political science, health and fitness and technology adaption.