Graph of Perfect Competition
A perfectly competitive market is characterized by a large number of firms with identical production cost structures that are selling identical products or services to a very large number of consumers. As a result, no single buyer or seller can independently influence the market price. Each seller simply chooses a level of output that maximizes economic profits, given the existing price. Each buyer is fully informed about all potential alternative sellers. Further, no barriers exist that would prevent any one firm from easily entering or exiting the market. Ultimately, the long-run equilibrium occurs when each firm in the industry supplies a quantity that generates zero economic profits in the long run.

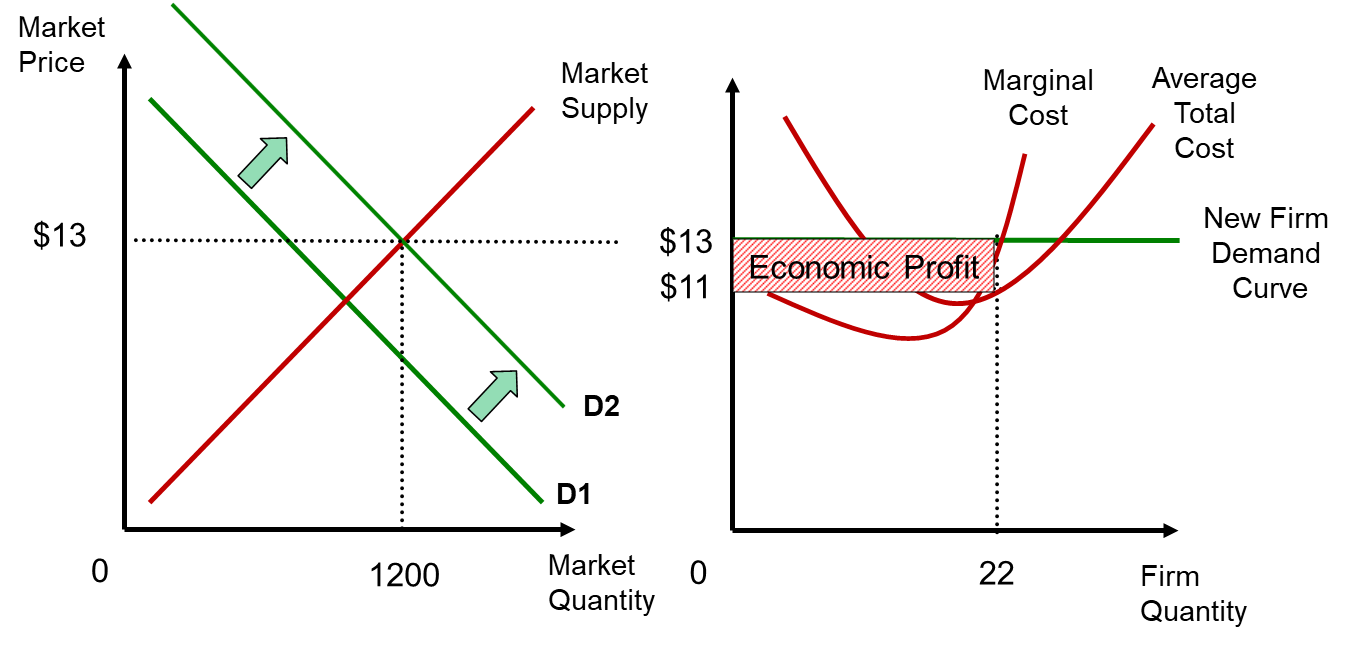
The overall market price determines the individual demand for each firm
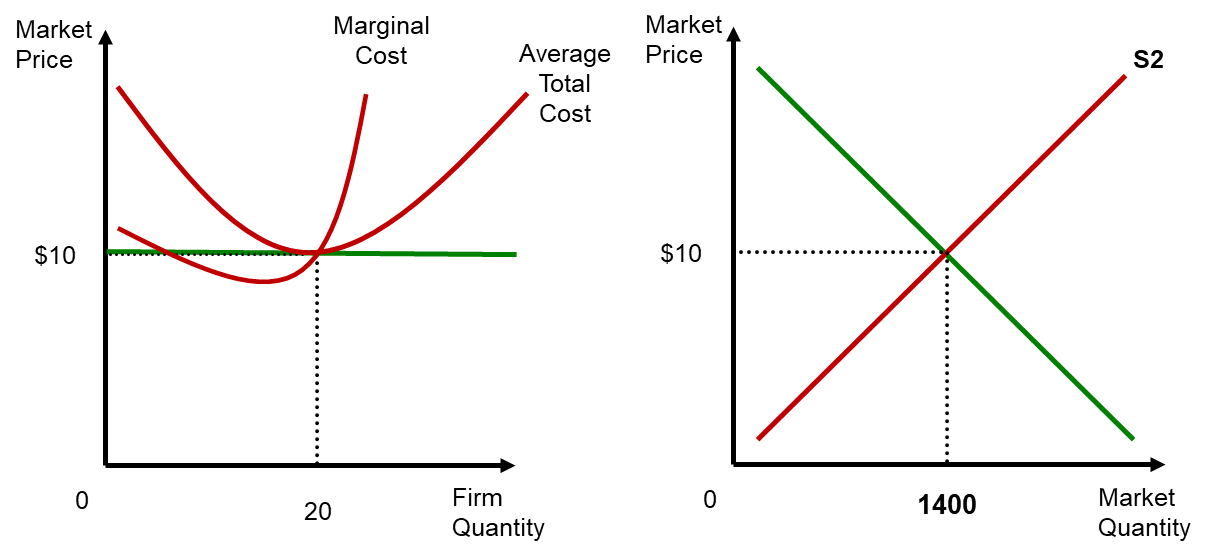
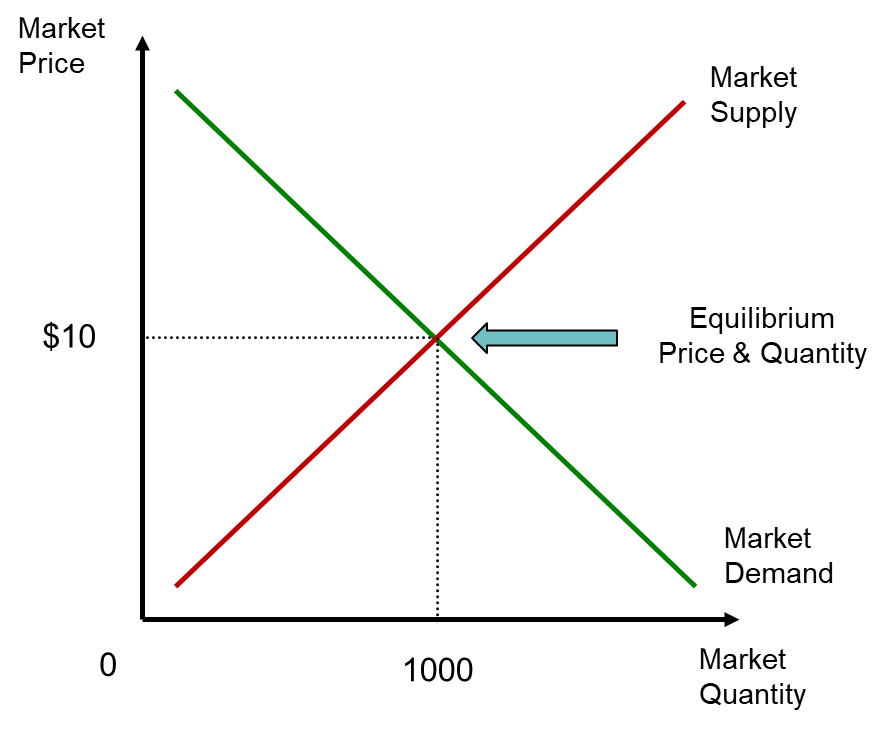
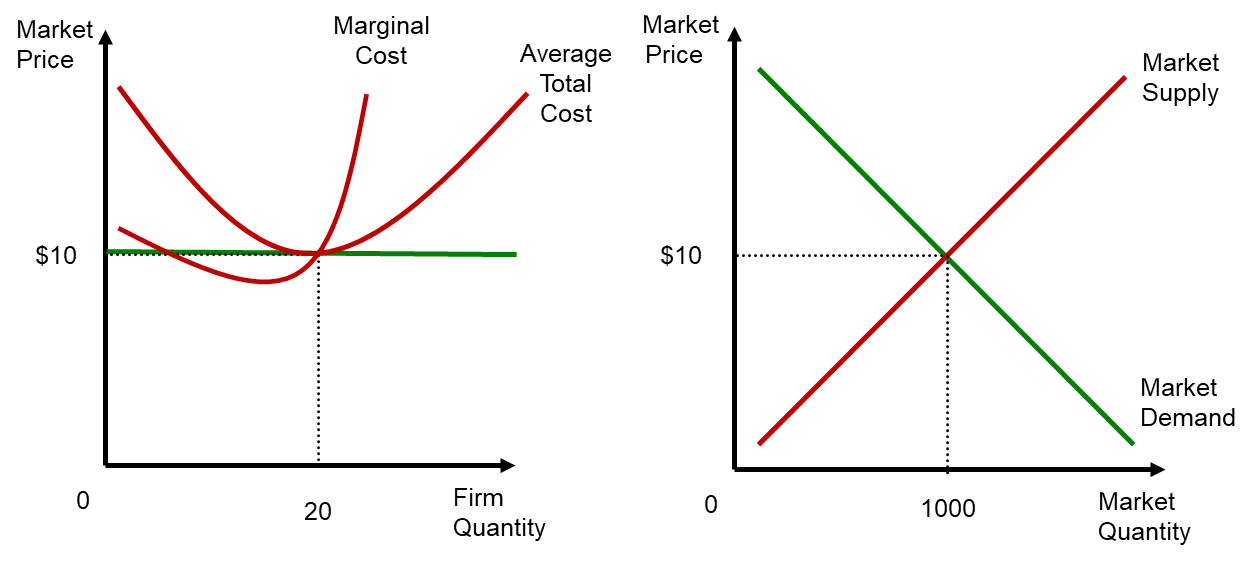
The economic impact of a large numbers of buyers and sellers interacting in the perfectly competitive market can be analyzed using a traditional demand and supply curves. The equilibrium market price occurs at the intersection of the market demand curve and supply curves, where the quantity demanded by the many consumers is equal to the quantity supplied by the many firms. In the example below, the horizontal axis reveals an equilibrium quantity of 1,000 units are produced by a total of 50 firms, with each firm producing 20 units per period. The vertical axis reveals these units are sold at a market price of $10 per unit.
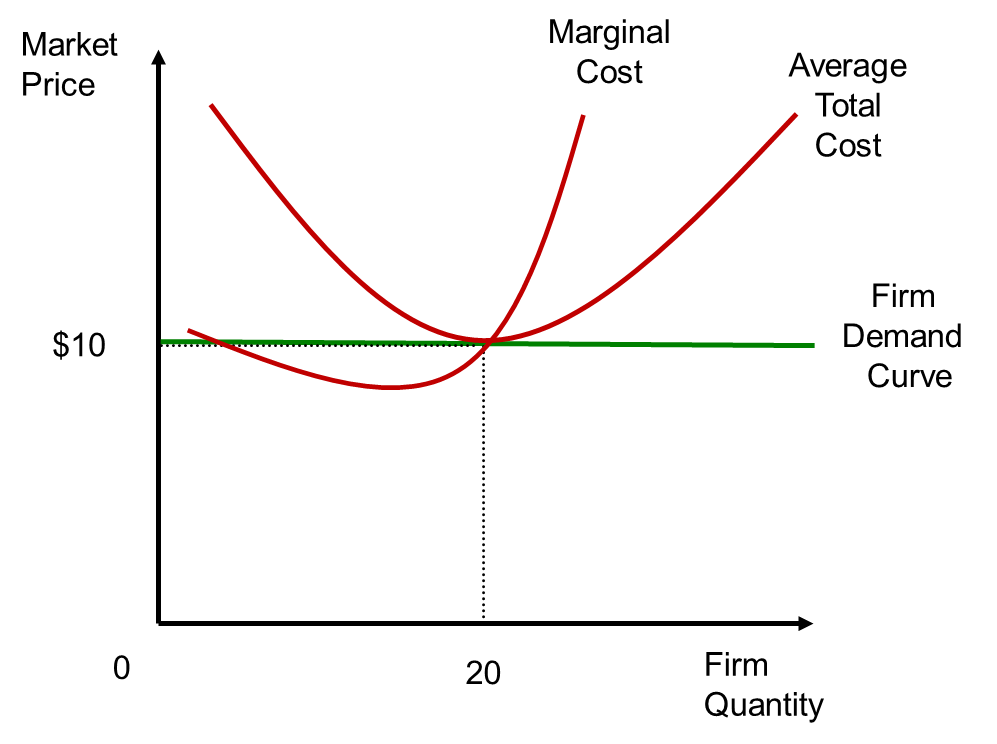
The firm’s own demand curve is the market equilibrium price at any level of output.
The characteristics of perfect competition imply that each firm has no market power to influence market price and simply takes the market price as it exists. This is why firms within a perfectly competitive market are called “price takers.” Indeed, all firms face individual horizontal demand curves that are perfectly elastic, where the each firm's marginal revenue curve (MR curve) is the same as the average revenue curve.
The large number of firms in the market are a result of each firm having only a relatively small capacity for producing output each period. This also implies that each firm can effectively sell as many units per period as desired at the existing market price, which represents the average revenue from selling the product or service.
How do perfectly competitive firms maximize their economic profits?
A perfectly competitive firm seeks to maximizes the difference between total revenues and total production costs to achieve maximum profits. Each firm operates where the marginal cost curve (MC curve) rises as the level of output produced increases. The profit-maximizing level of output occurs when a firm produces the quantity of output where the marginal cost for the last unit produced each period equals the marginal revenue (market price) received for selling each unit. To understand why this is so, consider the two alternative options.
If the firm decided to produce a smaller quantity than where marginal cost equals market price, the production cost of the last unit produced would be lower than market price (marginal revenue) received for selling that unit. Increasing output by one more unit would generate more additional revenue than additional cost. This implies that profits would increase by increasing output each period.
Similarly, if the firm produced at a higher quantity each period than where marginal cost equals market price, the production cost of producing the last unit would be higher than the market price (marginal revenue) received from selling that unit. Reducing output by one less unit would decrease production cost by more than the lost revenue. This implies that profits would increase by decreasing output each period.
Static Analysis of the Market Equilibrium for Perfectly Competitive Market
In the current example, all firms have the same production cost structure. At the current market equilibrium, each of the 50 firms choose to produce 20 units each for a total of 1000 units per period. If the market price is greater than the average total cost of production for each firm, the market supply curve for a perfectly competitive market is merely the horizontal summation of the marginal cost curves across the individual firms.
When the market price equals the average total cost (ATC) of production for each firm, no firm makes either an economic profit or an economic loss. Each firm makes a normal profit that is just enough to cover its total opportunity cost of production while supplying the market. This has two important implications.
First, no single firm within the market could do any better using its own resources to operate in another market, so there is no incentive for any firm to exit this market. Second, firms operating outside of the market observe the lack of economic profits being earned by existing firms and have no incentive to enter and compete in the market. This creates a stable market equilibrium that can be expected to endure until something significant changes for either market demand or the cost structure of the existing firms.
Dynamic Analysis of the Perfect Competition Model
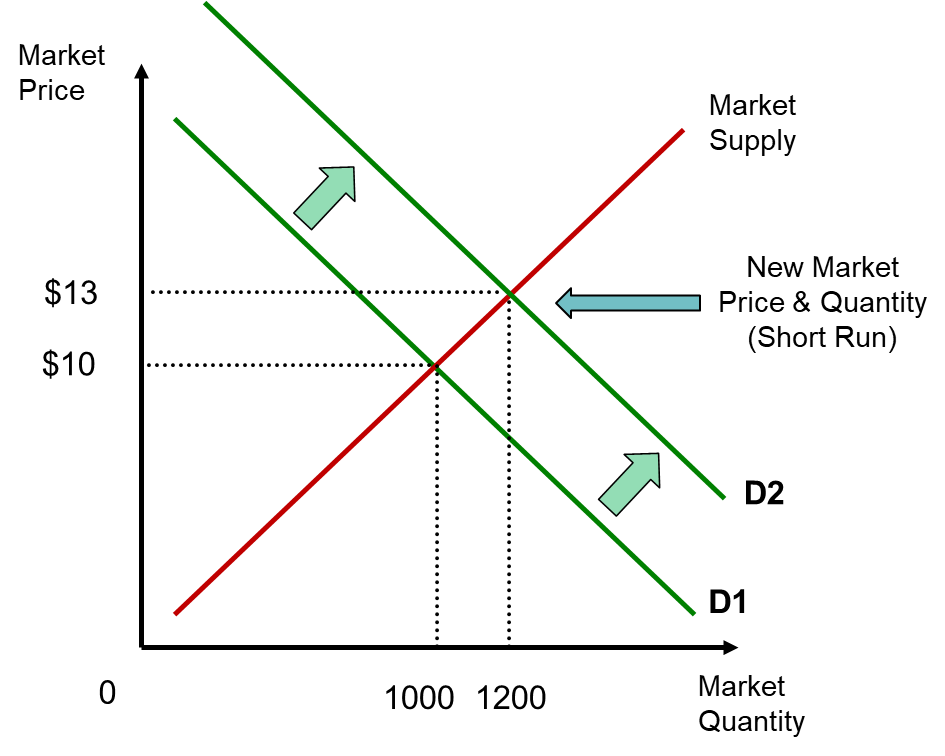
Examining the perfectly competitive market in the long run reveals that each firm ultimately makes zero economic profits, and the resulting level of market production is socially efficient. Consider what occurs when market demand changes, such as when an increase in consumer incomes generates greater demand at the existing market price. This would shift the market demand curve to the right, creating a higher market equilibrium price and quantity in the short run.
The example illustrated below reveals how the new market price will rise to $13 per unit and the new market quantity increases to 1200 units per period. There has not been sufficient time in this short-run analysis for any changes to occur in the number of firms operating within the market. Each firm has simply increased its own level of output to generate this new equilibrium quantity.
Existing Firms Now Make Economic Profit--Temporarily
This short run increase in market price has important implications for each firm’s demand curve and resulting economic profits. Recall how each of the 50 existing firms will choose to produce where marginal cost equals the new market price. At a price of $13, each firm receives a price per unit that exceeds the average total cost of production. When revenues exceed production costs, each firm now enjoys an economic profit.
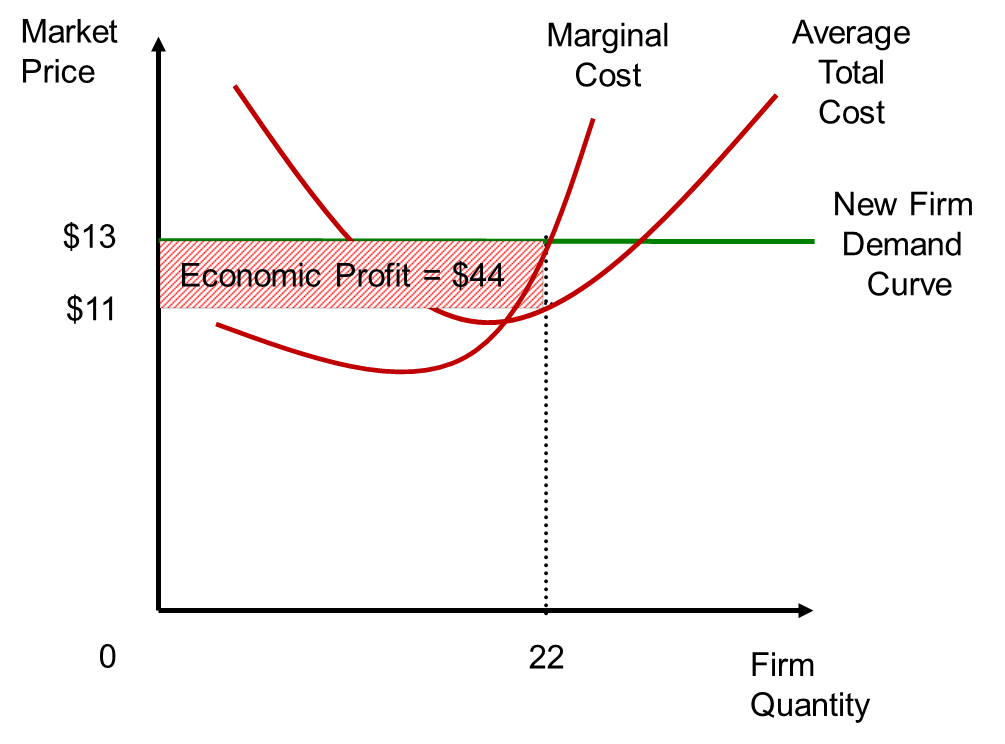
In the short run, each firm increases production to 22 units. They can sell each unit for $13 each, but each costs only $11 each to produce. This means each unit creates $2 profit, for a total economic profit of $44 each period. However, such economic profits are temporary in the perfectly competitive market. There are other firms operating outside the market which observe how each existing firm is now earning true economic profit. As there are no barriers preventing their entry into the market, some outside firms making only normal profits will enter the market to pursue positive economic profits.
The Impact of Outside Firms Entering the Market
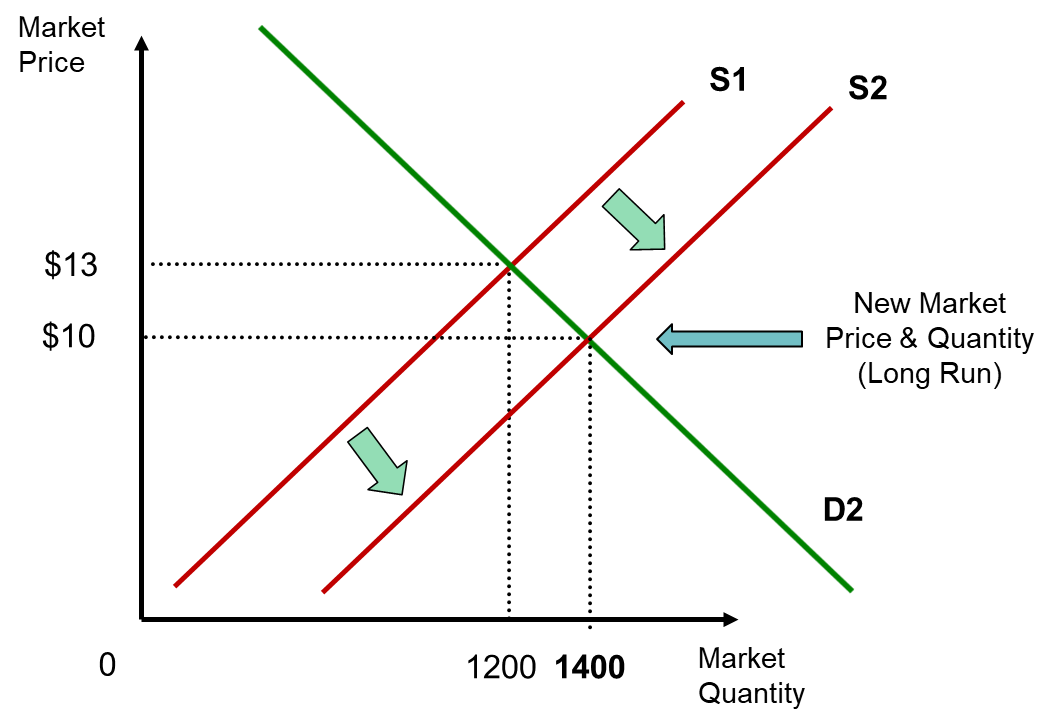
As these new firms enter the market and begin producing additional output, this increases the total quantity that is supplied at the existing price. This influx of new firms causes the market supply curve to shift to the right. As the supply curve shifts, the equilibrium market price is pushed downward.
As each firm faces a falling market price, their profit maximizing quantity of production decreases, as does their economic profits. The entry process of new firms stops when each firm within the market no longer makes an economic profit, eliminating any motivation for any further outside firms to enter the market. Each firm reduces output until normal profits are restored. Each firm supplies the same level of output that was produced before the demand curve changed. However, total output in the market is higher because there are now more firms operating in the market.
The Implications of a Perfectly Competitive Market
In the long run equilibrium, the resources used to produce goods and services in a perfectly competitive market achieve both productive efficiency and allocative efficiency in the economy. Consider the quantity of products and services that are allocated by the market in the long run. The marginal benefit of the last unit consumed is reflected by the equilibrium market price. The marginal cost of supplying the unit produced is equal to this market price. When marginal benefit of the last unit consumed is equal to the marginal cost of producing that unit, there is no other quantity that could be produced and consumed in the market that would generate greater net benefits to society.
Next, consider the total cost of producing that optimal quantity of products and services in the long run. The quantity supplied by these perfectly competitive firms is supplied at the lowest possible cost per unit. This is reflected by production taking place at the lowest point of the average total cost curve (ATC curve) for all firms. This socially optimal quantity of products and services cannot be supplied at a lower opportunity cost of production in society.