The Emergence of Hybrid Curve Dynamics After Inversion
The Emergence of Hybrid Curve Dynamics After Inversion
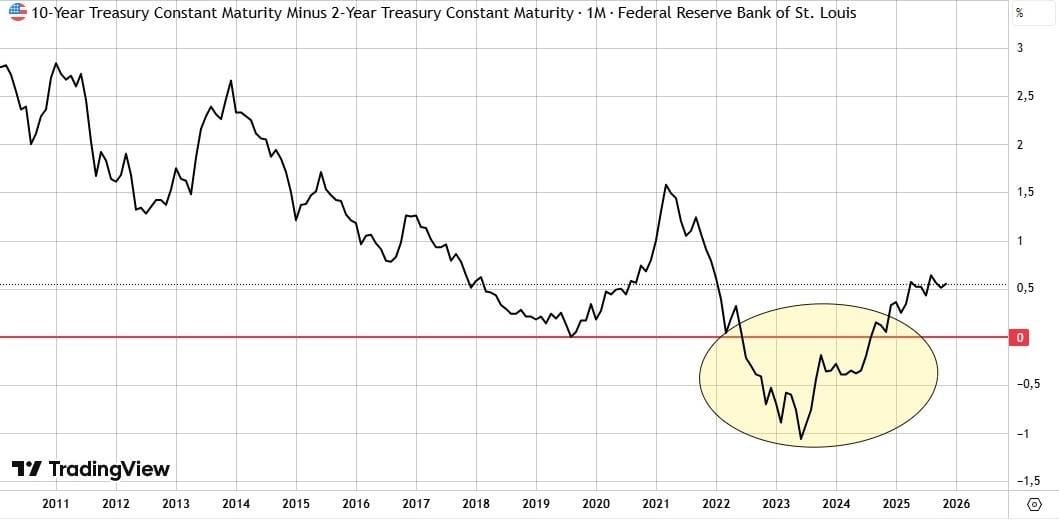
As of November 2023, the yield curve of the U.S. Treasury has normalised, with a positive spread of 51 basis points between the 2-Year and 10-Year Treasury Yields. The 10-Year Treasury yield stands at 4.12% and the 2-Year Treasury yield is 3.60%.

The normalisation of the yield curve represents the end of what has historically been the longest yield curve inversion since the 1980s, lasting a total of 793 days.
The chart below plots the difference between the 10-Year and 2-Year Treasury yields, with the shaded area representing the period of the yield curve inversion.
In general, an inverted yield curve is thought to be a leading indicator of a recession. In an inverted yield curve, short-term yields are greater than long-term yields, suggesting that investors have increased uncertainty about future growth and, consequently, increased risk for short-term investments.
In addition, investors believe that the Fed's current high rate policies are causing harm to the economy, which could lead to future interest rate cuts by the Fed; thus, investors are flocking to long-term Treasuries, pushing their prices up, and thereby lowering their yields.
On the other hand, the steepening of the yield curve is the process whereby the yield curve "normalises" and moves back to a positive slope, thereby increasing the difference between short- and long-term Treasury yields.
When discussing what is considered a steepening of the yield curve, there are two general categories based on cause and effect. These two categories are the bull steepening and the bear steepening.
In most instances, a bull steepening occurs during a recession while bear steepening occurs during times of rising long-term Treasury yields. As shown in the following paragraphs, both categories of steepening produce yields that have the same end effect on the curve, yet create different implications to investors.
- Bull Steepening: The bullish steepening is typically characterized by a higher rate of decline in 2-year Treasury yield rates versus 10-year Treasury yield rates during a recession. Bull steepening typically happens when the Fed has maintained its target interest rates at 0% and is acting to stimulate the economy by providing liquidity, either through quantitative easing or through other forms of monetary policy interventions. The following historical periods produced a bullish steepening of the yield curve: 1990-1992, 2001, 2003, 2008, and again in 2020.
Example of Bull Steepening: Suppose the 2-year yield falls from 5.00% to 3.00%, and the 10-year yield falls from 4.50% to 4.00%. The spread between these two yields therefore changed from -0.50% to 1.00%.
- Bear Steepening: On the other hand, bear steepening is characterized by a greater rate of increase in 10-year Treasury yields compared to 2-year Treasury yields. Bear steepening indicates that long-term Treasuries are bear market issues. The following historical periods had bear steepening: 1984, 1987, 1996, 1999, 2010, 2013, 2016, and 2021.
Example of Bear Steepening: In this example, the 2-year yield would remain constant at 4.00% while the 10-year yield increased from 4.00% to 5.00%. Therefore, the yield spread would have increased from 0% to 1.00%.
While both scenarios have the same end result — the normalisation of the curve via the same yield spread — the meaning for an investor in each case is quite different.
For bull steepening, the Fed may be aggressively lowering rates due to an economic slowdown, and therefore lower short-term interest rates faster than longer-term interest rates, signalling to investors that we are on the verge of a recession.
In contrast, bear steepening signals that a long-term Treasury yield is increasing at a faster pace than a short-term Treasury yield. Therefore, the investor is concerned about long-term inflation being part of the economic picture and the government will be creating additional long-term debt to finance higher government deficits.
The Federal Reserve reduced interest rates have created hybrid movement in the marketplace for the very first time; as a result short-term yields have fallen to flat line values which creates a bullish steepness of the yield curve and allow long-term yields from September to November 2025 to rise rapidly, creating the bear steep of the yield curve. The combination of various factors has resulted in a mixed market:
- As of the end of FY 2024 the U.S. Government Deficit was $1.8 trillion, the third largest Deficit in the history of the United States, and has been increasing year over year at a rate of 8.1%.
- Inflation rate peaked in mid-2022 at a high of 9.1% down to 2.5% at mid-2025, but still above the targeted Fed's goal of 2%.
- The Federal Reserve cannot reduce interest rates as quickly due to the ongoing increasing rate of inflation.
Bear steepness and subsequent resurgence from inversion were not only recorded for the first time historically, but speak to a larger issue, in which the Federal Open Market Committee (FOMC) presently has little confidence in its ability to control inflation thus effectively governing monetary policy.
A recession, if one were to occur, would limit the Fed's ability to reduce interest rates further, thus increasing the likelihood of an abrupt decline in prices and possibly even stagflation.
Whether or not the economic outcome will be a 'soft landing' or 'hard landing' will depend on what further economic data comes out in the coming months, as well as whether or not corporate earnings will be able to keep up with expectations.
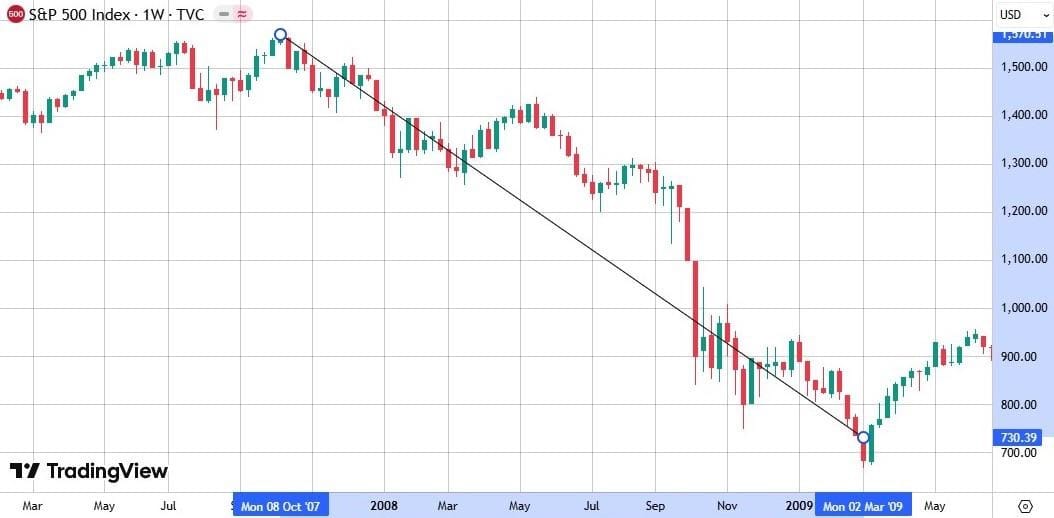
The consensus among economists was for a 2.5% GDP growth rate for the year following the onset of the recession in December 2007. During this period, the S&P 500 was at around 1,500 points (only about 5% lower than its peak) and the Fed had just begun to lower interest rates (4.25%) with the yield curve having returned to a normal state with a +50 bps spread. In a matter of 12 months, the S&P 500 dropped almost 47% to approximately 800, as seen on the SPX chart.
The current environment is at a pivotal point for global financial markets, with investors needing to exercise extreme caution regarding where they will invest, as well as being prepared to quickly respond to the potential shifting of both economic data and policies that may have implications over the next several months.