

Photo by UX Indonesia / Unsplash
Market Mapping: What It Means and How It's Used
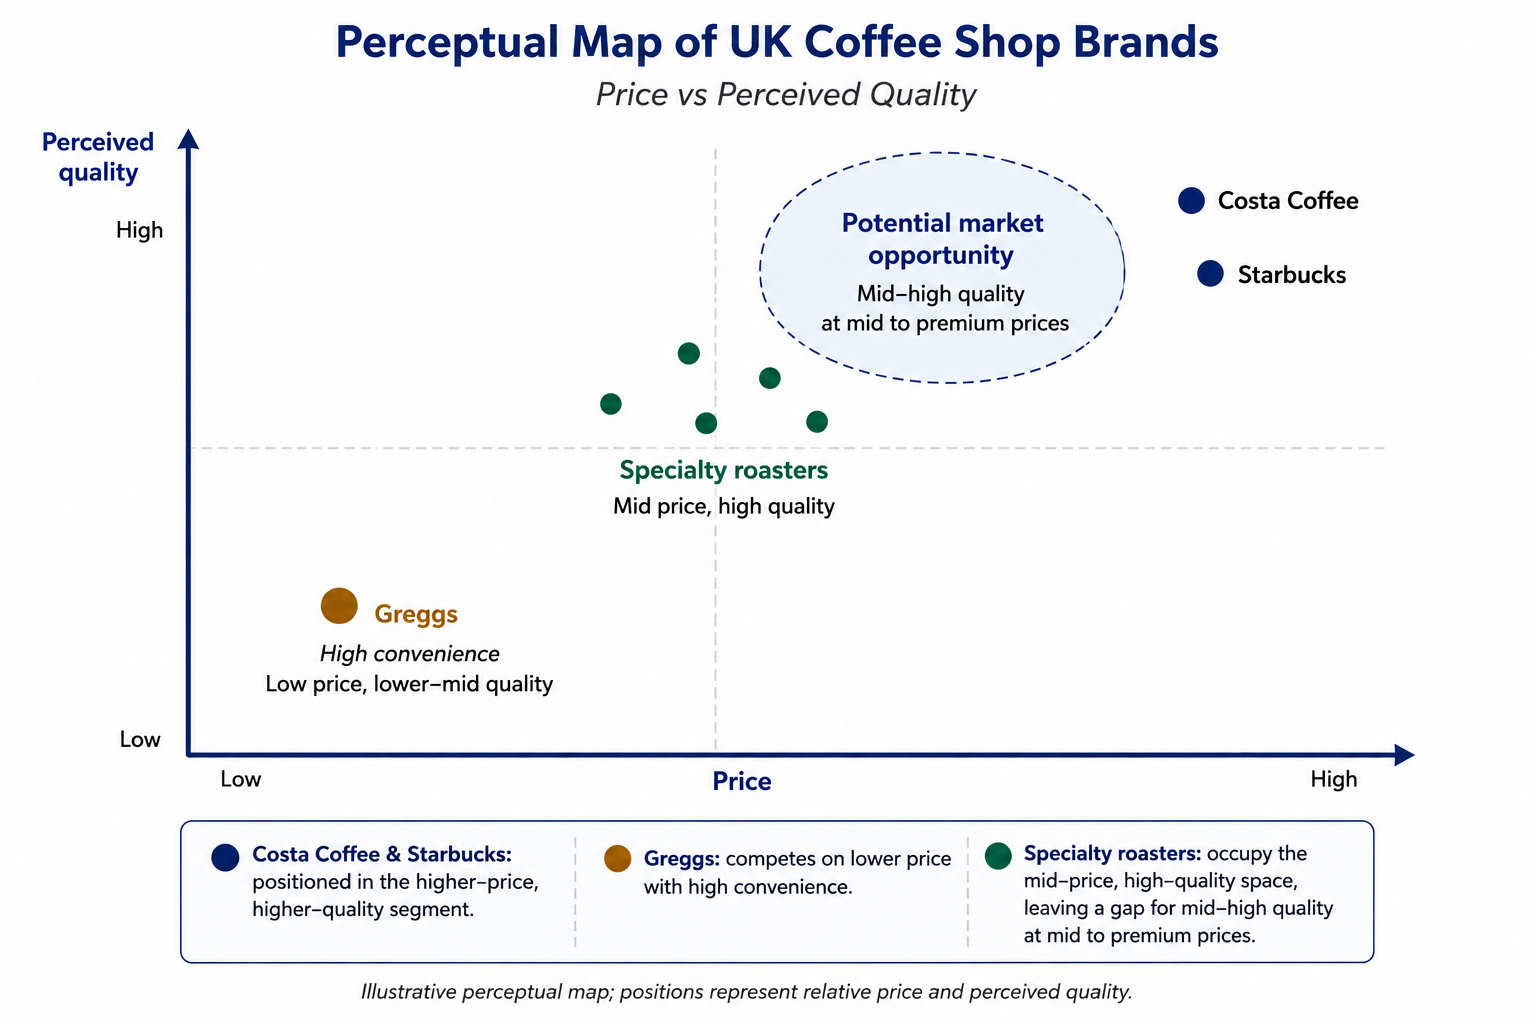
Market Mapping is a tool to help define and locate your competition within an industry by plotting competitors against two variable axes; typically Price and Quality. Examples of companies at opposite ends of the price/quality spectrum for coffee in the UK coffee market would be Costa Coffee and Starbucks, who would be considered to have higher prices and higher quality products, and on the other hand, Greggs which would typically have lower-priced products and a greater perceived convenience by consumers.
The economic theory behind Market Mapping is based on the Economic Theory of Monopolistic Competition, which is part of the broader concept of Market Structures, and on Product Differentiation. This article uses the term market mapping to refer to competitive positioning. The term is also used in mergers and acquisitions (M&A) to identify potential acquisition targets and in recruitment to identify suitable candidates.
What market mapping means
In classical economics, perfect competition assumes products are all exactly the same; therefore, price is the main consideration for consumers when purchasing goods. However, consumer-facing industries exhibit some form of imperfect competition (especially, monopolistic competition). For example, coffee shops, airlines, grocery stores and streaming services all sell products that are similar to, but differentiated from, those of their competitors.
This process is known as product differentiation. Companies compete through various characteristics (such as taste, service, brand identity, location, and ethical sourcing), rather than solely on price. By providing differentiated products, firms can establish a distinctive identity that appeals to certain segments of the market that are less price-sensitive, potentially supporting higher and more sustainable profit margins. Market mapping takes this theoretical framework and illustrates the differentiation between products within a particular marketplace. The result is a "map" that enables managers and analysts to visualise how each product is positioned relative to its competitors and to identify possible areas where product differentiation could occur.
How to build a market map
1. Select two pertinent axes: Choose two features that are important to customers and set apart competitors including price and perceived quality.
2. Pinpoint competitors and show them in the map: Create a list of the leading competitors in the market and mark them according to their position on the two chosen axes.
3. Search for clusters and gaps: Identify areas where many competitors are grouped together and areas where few or no brands are positioned.
4. Evaluate the market gaps: Crowded areas may show a tough competition while untapped areas could be a good opportunity for a venture to sell its goods or reach out to a new audience.
How Market Mapping Is Used
The growing importance of market mapping can be explained by three forces in the current marketplace: increasing levels of saturation in many areas of the market; the ability to access more sophisticated consumer data; and rising input costs, from raw materials to transportation. As an example, the UK branded coffee shop market was valued at £6.1 billion in 2025, with 11,456 outlets. Costa Coffee was the UK's largest branded coffee chain by outlet numbers, followed by Greggs and Starbucks. Costa and Starbucks occupy relatively premium positions in terms of price and perceived quality, while Greggs competes through lower prices and convenience.
Through the use of perceptual maps comparing price and perceived quality, it is possible to determine how coffee-shop brands are positioned within the market. The map below illustrates how Costa Coffee and Starbucks occupy the higher-price, higher-quality area, while Greggs competes at a lower price with high convenience. Specialty roasters occupy the mid-price, high-quality area, highlighting a potential gap for businesses seeking to differentiate themselves.
What Market Maps Reveal
Market mapping is critical to firms, as it provides insights into their competitive dynamics. Specifically, when firms operate in crowded clusters, they face greater price competition because the availability of close substitutes can make demand more price elastic, increasing pressure on firms to compete on price. On the other hand, firms that identify an underserved market segment and then effectively differentiate their brands from competitors can pursue premium pricing.
From the consumer perspective, the availability of more differentiated products increases consumer choice and can potentially improve consumer welfare. Additionally, however, monopolistic competition can result in excess capacity when firms operate below the output level that minimises average costs.
In the UK coffee market, the continued growth in outlet numbers, alongside modest productivity growth per outlet, can illustrate the potential for excess capacity, although these trends alone do not establish that excess capacity exists. The rise in UK coffee prices, which increased by approximately 26.8% between 2022 and 2025, was largely driven by higher coffee bean and other input costs.
For both policymakers and market analysts, market maps are an effective tool for identifying the competitive dynamics within a given industry. Specifically, they highlight areas of intense competition and fragmentation into smaller, less directly comparable segments.
Sources
- World Coffee Portal. Value in the spotlight as competition heats up in £6.1bn UK branded coffee shop market. World Coffee Portal source
- Office for National Statistics (ONS). CPI INDEX 01.2.1.1 Coffee 2015=100, Consumer Price Inflation time series (MM23). ONS source

